
Prothrombin Time (PT)

Optimal result: 9 – 11.5 seconds

Reasons for increased levels (blood clotting too slow):

The prothrombin time is made longer by:

- Blood-thinning medicine, such as warfarin.

- Low levels of blood clotting factors.

- A change in the activity of any of the clotting factors.

- The absence of any of the clotting factors.

- Other substances, called inhibitors, that affect the clotting factors.

- An increase in the use of the clotting factors.

An abnormal prothrombin time is often caused by liver disease or injury or by treatment with blood thinners.


Decreased Prothrombin Time (PT): Causes, Implications, and Management

While decreased Prothrombin Time (PT) is less common than prolonged PT, it can occur under specific circumstances. Below are potential causes and their associated mechanisms:

Potential Causes of Decreased PT

  1. Hypercholesterolemia or Hypertriglyceridemia

    • Elevated fibrinogen and factor VII levels can lead to shorter PT measurements.
  2. Polycythemia

    • A hematocrit greater than 55% reduces plasma volume in blood samples, resulting in decreased PT values.
  3. Vitamin K Supplementation

    • Increased intake of vitamin K (dietary or supplemental) may reduce PT/INR levels.

Management Options for Decreased PT

Treatment depends on addressing the underlying cause:

  • For Hyperlipidemia:

    • Lifestyle changes: A balanced diet and regular exercise.
    • Lipid-lowering medications (e.g., statins), if necessary.
  • For Polycythemia:

    • Phlebotomy to reduce hematocrit levels.
    • Managing the underlying cause (e.g., treating a JAK2 mutation in polycythemia vera).
  • For Excessive Vitamin K Intake:

    • Adjust dietary or supplemental vitamin K intake under medical supervision.

Clinical Relevance of Decreased PT

  • General Considerations:
    Decreased PT is typically not a primary indicator of bleeding disorders. However, identifying and addressing the underlying condition is crucial for maintaining overall health.

  • In Patients on Vitamin K Antagonist Therapy (e.g., Warfarin):
    A decreased PT/INR may indicate:

    • Insufficient anticoagulation.
    • A need for dose adjustment.
    • An increased risk of thrombosis.
    • Treatment involves modifying the anticoagulant dose to achieve the therapeutic target INR (typically 2–3 for most indications).

Key Takeaway

Always consult a healthcare provider for the proper interpretation of abnormal PT results and individualized treatment plans. Addressing the root cause is essential for effective management and preventing complications.

Prothrombin time (PT) is a blood test that measures the time it takes for the liquid portion (plasma) of your blood to clot.

Prothrombin time (PT) is a blood test that measures the time it takes for the liquid portion (plasma) of your blood to clot. A prothrombin time test can be used to check for bleeding problems. PT is also used to check whether medicine to prevent blood clots is working. A PT test may also be called an INR test.

The prothrombin time is one of several tests that check if your blood is clotting normally. Blood clotting (coagulation) is needed to help stop bleeding. Proteins in the blood called clotting factors (coagulants) help blood become sticky and clot.

As soon as you start to bleed somewhere in or on your body, platelet cells in the blood collect around the bleeding area. The platelet cells and coagulants then react to thicken the blood and stop the bleeding. Problems in the blood, such as low levels of clotting factors or platelets, can keep blood from clotting normally and cause too much bleeding.

Clotting factors are usually made by the liver. Prothrombin is one type of clotting factor. When bleeding occurs in the body, prothrombin quickly changes to thrombin. The prothrombin time test measures how quickly prothrombin changes to thrombin to stop the bleeding. If the prothrombin doesn't change as quickly as normal, you may have a blood clotting disorder.

The test may be used to help diagnose inherited disorders and other conditions that may affect blood clotting. These include:

- Vitamin K deficiency

- Deficiency in clotting factor I, II, V, VII, or X

- Diseases of the liver

- Hemophilia

- Problems with the bone marrow

- Von Willebrand disease

- Problems with the immune system

- Some types of cancer, including leukemia

Why are results reported in seconds and percent?

PT test results used to be given in seconds, along with a control value. The control value usually varied somewhat from day to day because the reagents used varied. The PT value was supposed to be approximately equal to the control value. Some laboratories used to report PT values as percentages of normal activity, because the results were compared with a curve representing normal clotting time. A normal PT result was 85% to 100%. To have uniform PT results for physicians in different parts of the country and the world, the World Health Organization has recommended that PT results include the use of the international normalized ratio (INR) value. The reported INR results are independent of the reagents or methods used. Many hospitals are now reporting PT times in both absolute and INR numbers.

Other blood clotting tests:

Other blood clotting tests, such as partial thromboplastin time (PTT) and activated clotting time (aPTT), might be used if you take another type of blood-thinning medicine called heparin (instead of warfarin, for example). These tests measure other clotting factors, or they may be used to see if you are getting the right dose of heparin. Partial thromboplastin time and prothrombin time are often done at the same time to check for bleeding problems or the chance for too much bleeding in surgery.

Prothrombin Time (PT)
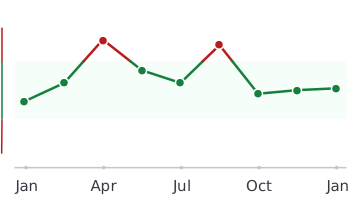
Healthmatters dashboard showing biomarker trend graph

Every lab result you’ve ever had, charted and explained.

Healthmatters is a tracker for your lab results. Upload a report from any lab, any country — every marker charted and explained.

Start with my report →
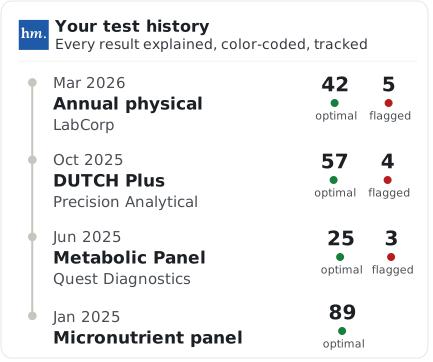
Beyond Prothrombin Time (PT) — 10,000+ markers explained
One Prothrombin Time (PT) result tells you where you are. Your history tells you where you’re heading. Upload your past lab reports and see this marker — and every marker on them —every marker charted against your own lab’s ranges.
Start with this report →
Healthmatters timeline preview showing biomarker trends over time
Clinical Sources & References

All our content is backed by peer-reviewed studies, academic research, and trusted medical sources. We’re committed to accuracy and transparency — see our editorial policy for details.

Article Review Log
Written by Healthmatters Editorial Team
Healthmatters Lifetime Plan

Pay $250. Track your health forever

One payment. No renewals. Yours for life.

10,000+ biomarkers explained · trends over time

See other plans →
Secure checkout via Stripe · GDPR & HIPAA
We accept results from any lab
LabCorp Quest Diagnostics Genova Diagnostics DUTCH Test Doctor's Data Vibrant America ZRT Laboratory Cyrex Labs + any other lab

What members are saying

★★★★★ 10,000+ happy members
★★★★★

"Watching my numbers move over the years — instead of forgetting last time's results — completely changed how I manage my health."

Daniel
Member since 2022
★★★★★

"Living across several countries made keeping my lab results organized a real challenge. Healthmatters brought my results from the USA, Spain, and Germany together — 20 years of history, with long-term trends instead of scattered reports."

Ben
Member since 2021 · tracks across countries
★★★★★

"Standard lab ranges are too wide for how I practice — 'normal' isn't optimal. I set my own bands, so a client sees yellow before a marker goes officially out of range. That's the conversation I want to be having."

Dr. Alexandra
Functional medicine · 6 yrs on Pro