
Esterified/Free Ratio

Optimal result: 0.13 – 0.42 Ratio

This pattern can be seen during a catabolic state, secondary to carnitine supplementation, or in metabolic disorders (organic acidemias or fatty acid oxidation defects). If clinically indicated, please consider quantitative urine organic acid and plasma acylcarnitine analyses.

An elevated esterified/free carnitine ratio in the body indicates a higher proportion of carnitine is present in its esterified form (such as acylcarnitine) compared to its free form. This shift can suggest several metabolic conditions or states. In a healthy metabolic process, carnitine cycles between its free form and its esterified form (bound to acyl groups) to transport fatty acids into mitochondria for energy production. An elevated ratio may imply an accumulation of acylcarnitines, which can occur if there is a disruption in mitochondrial fatty acid oxidation. This disruption could be due to metabolic disorders, mitochondrial dysfunction, or inadequate coenzyme Q10 levels, which are essential for the proper function of the electron transport chain.

Such an imbalance might indicate that the body is either producing more esterified carnitine than it can utilize or is facing difficulties in converting esterified carnitine back to its free form. This can lead to an accumulation of fatty acids or toxic intermediates, potentially resulting in metabolic complications. Conditions such as organic acidemias, fatty acid oxidation disorders, and even some forms of muscular dystrophies might present with an increased esterified/free carnitine ratio. Therefore, this ratio is an important marker for assessing mitochondrial function and fatty acid metabolic status, warranting further investigation to identify the underlying cause and to manage potential metabolic disturbances effectively.

The esterified/free carnitine ratio, often measured in clinical settings, is a valuable indicator of carnitine metabolism balance within the body. This ratio compares the amount of carnitine bound to fatty acids (esterified carnitine) to the amount of carnitine in its free, unbound form. A balanced ratio is crucial for efficient energy production, as carnitine plays a key role in transporting fatty acids into mitochondria for oxidation.

The esterified/free carnitine ratio, often measured in clinical settings, is a valuable indicator of carnitine metabolism balance within the body. This ratio compares the amount of carnitine bound to fatty acids (esterified carnitine) to the amount of carnitine in its free, unbound form. A balanced ratio is crucial for efficient energy production, as carnitine plays a key role in transporting fatty acids into mitochondria for oxidation.

An elevated esterified/free carnitine ratio may suggest a disruption in normal metabolic processes, indicating that the body is either producing or retaining more esterified carnitine than it can utilize or convert back into its free form. This imbalance can be caused by various factors, including metabolic disorders, increased fatty acid oxidation, or issues related to the transport and utilization of carnitine in the mitochondria. In some cases, it may also reflect a diet excessively high in certain fats or the body's response to increased energy demands. Understanding changes in this ratio can help healthcare professionals diagnose and monitor conditions related to energy metabolism and carnitine balance, guiding nutritional and therapeutic interventions to restore metabolic equilibrium and support overall health.

Esterified/Free Ratio
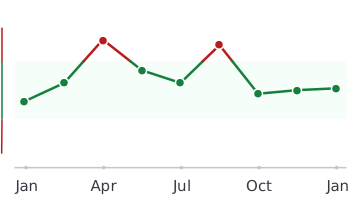
Healthmatters dashboard showing biomarker trend graph

Every lab result you’ve ever had, charted and explained.

Healthmatters is a tracker for your lab results. Upload a report from any lab, any country — every marker charted and explained.

Start with my report →
Beyond Esterified/Free Ratio — 10,000+ markers explained
One Esterified/Free Ratio result tells you where you are. Your history tells you where you’re heading. Upload your past lab reports and see this marker — and every marker on them —every marker charted against your own lab’s ranges.
Start with this report →
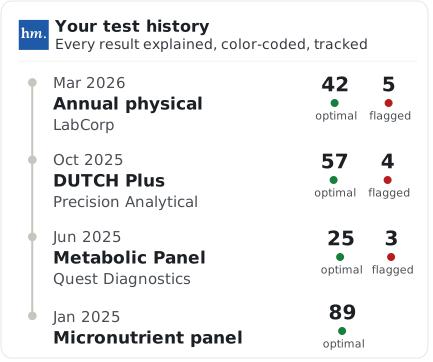
Healthmatters timeline preview showing biomarker trends over time
Clinical Sources & References

All our content is backed by peer-reviewed studies, academic research, and trusted medical sources. We’re committed to accuracy and transparency — see our editorial policy for details.

Article Review Log
Written by Healthmatters Editorial Team
Healthmatters Lifetime Plan

Pay $250. Track your health forever

One payment. No renewals. Yours for life.

10,000+ biomarkers explained · trends over time

See other plans →
Secure checkout via Stripe · GDPR & HIPAA
We accept results from any lab
LabCorp Quest Diagnostics Genova Diagnostics DUTCH Test Doctor's Data Vibrant America ZRT Laboratory Cyrex Labs + any other lab

What members are saying

★★★★★ 10,000+ happy members
★★★★★

"Watching my numbers move over the years — instead of forgetting last time's results — completely changed how I manage my health."

Daniel
Member since 2022
★★★★★

"Living across several countries made keeping my lab results organized a real challenge. Healthmatters brought my results from the USA, Spain, and Germany together — 20 years of history, with long-term trends instead of scattered reports."

Ben
Member since 2021 · tracks across countries
★★★★★

"Standard lab ranges are too wide for how I practice — 'normal' isn't optimal. I set my own bands, so a client sees yellow before a marker goes officially out of range. That's the conversation I want to be having."

Dr. Alexandra
Functional medicine · 6 yrs on Pro