
Fasting Insulin Normal Range (µIU/mL): High, Low, Units & Insulin Resistance
Other names: Insulin Fasting, Fasting Insulin, Insulin - Fasting, INSULIN FASTING, Insulin (Fasting), Fasting Insulin Level, Fasting Serum Insulin, Serum Insulin Fasting, Basal Insulin, Fasting Plasma Insulin, Insulin Level Fasting, Insulin Blood Test Fasting, Fasting Insulin µIU/mL, Fasting Insulin uIU/mL, Fasting Insulin uu/ml, Fasting Insulin µU/mL, Fasting Insulin mIU/L, Fasting Insulin pmol/L, Insulin UIU/ML, Insulin UU/ML, Insulin uIU/mL Normal Range, Normal Fasting Insulin Levels uIU/mL, Insulin Serpl-Acnc, Insulin Fasting ECLIA, Insulin Intact LC/MS/MS (related), Nüchterninsulin (German), Insulina en Ayunas (Spanish), Insuline à Jeun (French)
 Optimal Result:
2.6 - 24.9 uIU/ml,
or
26 - 249 pmol/L.
Optimal Result:
2.6 - 24.9 uIU/ml,
or
26 - 249 pmol/L.

WHAT DO µIU/mL, uIU/mL, µU/mL, uu/ml, AND mIU/L MEAN?
This is the most common confusion on fasting insulin results — and the answer is simple.
µIU/mL, µU/mL, uIU/mL, and mIU/L are all the same unit.
- µIU/mL = microinternational units per millilitre
- µU/mL = microunits per millilitre (same thing)
- uIU/mL = same unit, different typographic convention (u = µ when Greek letter unavailable)
- uu/ml = same unit again (both u's represent µ)
- mIU/L = milli-international units per litre (numerically identical: 1 µIU/mL = 1 mIU/L)
- µUI/mL or uUI/mL = same unit in Spanish/Portuguese convention
If your report shows a value with any of these units, the reference range is the same: 2.6–24.9.
Converting to pmol/L: Some labs (particularly outside the US) report insulin in pmol/L. The correct conversion factor for human insulin is debated — many online calculators use 6.945, but published insulin standardisation research supports 6.00 pmol/L per µIU/mL for human insulin. Because conversion factors vary by assay and lab convention, always compare your result against the reference range printed on your own report rather than relying on converted values.
| Unit | Approx. reference range | Approx. optimal range |
|---|---|---|
| µIU/mL / µU/mL / uIU/mL / mIU/L | 2.6–24.9 | 2–10 |
| pmol/L (using factor 6.00) | ~16–149 pmol/L | ~12–60 pmol/L |
| pmol/L (using factor 6.945) | ~18–173 pmol/L | ~14–70 pmol/L |
Always compare against the reference range on your specific lab report — do not rely on converted values alone.
QUICK ANSWER
Fasting insulin measures how much insulin your body produces after an overnight fast. Standard lab reference range: 2.6–24.9 µIU/mL. Many metabolic-health clinicians consider roughly 2–10 µIU/mL favourable, though no universally accepted optimal range exists. Higher fasting insulin may indicate early insulin resistance even when glucose and HbA1c remain normal.
Insulin assays are not fully standardised across laboratories — reference ranges may vary slightly between labs. Always use the range on your specific report.
Key takeaway: Many people with insulin resistance still have completely normal fasting glucose and HbA1c. Fasting insulin often rises first — sometimes years earlier. You can have insulin resistance for years before fasting glucose becomes abnormal.
MOST COMMON RESULTS AT A GLANCE
| Your fasting insulin (µIU/mL) | What it usually means |
|---|---|
| < 2 | Very low — may reflect excellent insulin sensitivity, low-carbohydrate intake, or reduced insulin production |
| 2–6 | Optimal — low end of healthy range |
| 6–10 | Optimal to high-normal — within most optimal ranges |
| 10–15 | High-normal — possible early insulin resistance; evaluate with HOMA-IR |
| 15–24.9 | Within lab range but functionally elevated — insulin resistance likely |
| > 24.9 | Above lab reference range — significant hyperinsulinemia |
| > 50 | Markedly elevated — consider insulinoma or severe insulin resistance |
All values in µIU/mL. Insulin assays are not standardised across labs — results from different labs may not be directly comparable.
THE LAB REFERENCE RANGE VS THE OPTIMAL RANGE
This is the single most important thing to understand about fasting insulin interpretation.
The lab reference range (2.6–24.9 µIU/mL) is derived statistically from a large population. It represents the range within which 95% of the tested population falls. The problem: that population includes many people with early-stage insulin resistance who don't yet have diabetes — inflating the upper "normal" limit.
The optimal/functional range (2–10 µIU/mL) is used by metabolic health specialists and researchers focused on early prevention. It reflects values associated with good insulin sensitivity and lower metabolic risk.
| Your result | Lab says | Many clinicians consider |
|---|---|---|
| 2–10 µIU/mL | Normal | Optimal |
| 10–15 µIU/mL | Normal | Possible early insulin resistance |
| 15–24.9 µIU/mL | Normal (upper range) | Insulin resistance likely |
| > 24.9 µIU/mL | High | Significant hyperinsulinemia |
Bottom line: A result within the lab's reference range does not automatically mean insulin metabolism is optimal. If your fasting insulin is above 10 µIU/mL and other metabolic risk factors are present — abdominal weight, high triglycerides, low HDL, trending fasting glucose — it may be worth discussing with your doctor.
WHAT SPECIFIC VALUES MEAN
| Result (µIU/mL) | Interpretation |
|---|---|
| 1.8–2.5 | Low-normal — excellent insulin sensitivity or very low carb diet |
| 2.6 | At lower reference limit — normal |
| 2.6–6 | Optimal range |
| 6–10 | Good to high-normal |
| 10–12 | Borderline — possible early insulin resistance |
| 12–15 | Mildly elevated functionally |
| 15–20 | Likely insulin resistance — evaluate with HOMA-IR and fasting glucose |
| 20–24.9 | High-normal by lab range; significant functionally |
| 24.9–25 | At or above upper reference limit |
| > 25–30 | Above lab range — clinical evaluation appropriate |
Always compare against the reference range on your specific lab report.
HIGH FASTING INSULIN: WHAT IT MEANS
High fasting insulin most commonly reflects insulin resistance — your cells have become less responsive to insulin, forcing the pancreas to compensate by producing more.
Why this matters: Fasting insulin rises during the compensation phase — years before blood glucose becomes abnormal. This is the window for intervention.
Common causes:
- Insulin resistance (most common by far)
- Abdominal obesity and excess visceral fat
- Sedentary lifestyle
- High refined carbohydrate and ultra-processed food intake
- Poor sleep quality or insufficient sleep
- Chronic psychological stress (cortisol raises insulin)
- Polycystic ovary syndrome (PCOS) — elevated fasting insulin is extremely common in PCOS and may occur even in women with normal fasting glucose and normal body weight
- Non-alcoholic fatty liver disease (NAFLD)
- Metabolic syndrome
- Corticosteroid use
- Rare: insulinoma (insulin-secreting tumour — consider if fasting insulin is very high alongside very low fasting glucose)
High fasting insulin with normal glucose: This is the most clinically important pattern. The pancreas is compensating successfully — glucose stays normal, but at the cost of elevated insulin. Over time this compensation breaks down. High fasting insulin with normal glucose is the early warning window. You can have insulin resistance for years before fasting glucose becomes abnormal.
Clinical context matters: Interpretation should always consider medications (especially corticosteroids), fasting duration, recent illness, exercise in the preceding 24 hours, and overall metabolic context. A single result should not be interpreted in isolation.
LOW FASTING INSULIN: WHAT IT MEANS
Low fasting insulin — below 2–3 µIU/mL — means minimal background insulin is circulating.
Common causes:
- Excellent insulin sensitivity — lean, physically active individuals
- Very low carbohydrate or ketogenic diet
- Extended fasting
- Type 1 diabetes — autoimmune beta cell destruction
- Advanced type 2 diabetes with beta cell exhaustion
Is low fasting insulin good? In a healthy individual with normal fasting glucose and HbA1c, a low fasting insulin is an excellent sign — efficient insulin signalling. In someone with diabetes or suspected T1D, very low insulin reflects inadequate production and requires medical management. Low insulin with normal glucose = reassuring. Low insulin with elevated glucose = evaluate for beta cell insufficiency.
FASTING INSULIN AND HOMA-IR
Fasting insulin is most powerful when combined with fasting glucose to calculate HOMA-IR.
HOMA-IR = (fasting insulin µIU/mL × fasting glucose mg/dL) ÷ 405 or HOMA-IR = (fasting insulin µIU/mL × fasting glucose mmol/L) ÷ 22.5
HOMA-IR below 1.0 is generally considered optimal; above 2.0–2.5 suggests insulin resistance in most populations. A high fasting insulin directly raises the HOMA-IR score.
See the dedicated HOMA-IR page for full interpretation.
How fasting insulin compares to other metabolic markers:
| Test | What it measures | Typically becomes abnormal |
|---|---|---|
| Fasting insulin | Insulin production at rest | Earliest — often years before glucose rises |
| HOMA-IR | Calculated insulin resistance estimate | Early — derived from insulin + glucose |
| Fasting glucose | Blood sugar after overnight fast | Later than insulin |
| HbA1c | 3-month average blood glucose | Often latest — reflects established dysfunction |
This is why fasting insulin is clinically valuable: it provides a window to intervene before glucose and HbA1c become abnormal.
NON-FASTING INSULIN LEVELS
Non-fasting insulin — measured at a random time or after a meal — behaves very differently from fasting insulin and cannot be interpreted using the same reference ranges.
After eating, especially carbohydrates, insulin rises sharply in healthy individuals and can reach 30–100 µIU/mL or higher depending on meal composition and individual metabolic response. This post-meal spike is entirely expected and normal. A result of 25 µIU/mL which would be at the upper limit of the fasting reference range is unremarkable for a non-fasting sample taken 1–2 hours after eating.
Key rules for non-fasting insulin:
- Do not apply fasting reference ranges to non-fasting results
- Random insulin testing is not useful for assessing insulin resistance — fasting conditions are required
- If your result is labelled "random" or you ate before the test, the result should not be compared to the 2.6–24.9 µIU/mL fasting range
If you received a non-fasting insulin result and are unsure how to interpret it, check whether the report specifies fasting or non-fasting — and discuss with your doctor before drawing conclusions.
HOW THE FASTING INSULIN TEST IS PERFORMED
What it is: A standard blood draw — serum or plasma sample — taken after an overnight fast. No special procedures required beyond fasting.
How to prepare:
- Fast for 8–12 hours before the test — overnight fasting before a morning draw is the standard approach
- Water is permitted and encouraged
- Avoid all calories including coffee with milk or cream, juice, or chewing gum — even small caloric intake can transiently raise insulin and affect the result
- Plain black coffee is generally considered acceptable by many labs, though some protocols ask you to avoid it entirely — check with your lab
- Avoid intense exercise in the 24 hours before the test — vigorous activity temporarily affects insulin sensitivity
What it's usually paired with: Fasting insulin is most informative when ordered alongside fasting glucose, as both are required to calculate HOMA-IR. HbA1c and a fasting lipid panel (triglycerides, HDL) are also commonly ordered together for a full metabolic picture.
Test name on lab orders: You may see it ordered as "insulin, fasting," "fasting insulin," "insulin (fasting)," or "serum insulin fasting." It is not the same as a glucose test or HbA1c — it requires a specific insulin assay.
Is fasting insulin a standard test? It is not included in most routine panels (CMP, CBC, or standard metabolic panels). It must be specifically ordered. If you want it tested, you will usually need to ask your doctor to add it to your lab order.
COMMON PHRASES SEEN ON LAB REPORTS
INSULIN (FASTING) / INSULIN - FASTING / INSULIN, FASTING
INSULIN FASTING / FASTING INSULIN / FASTING SERUM INSULIN
BASAL INSULIN / FASTING PLASMA INSULIN
INSULIN µIU/ML / INSULIN uIU/mL / INSULIN UU/ML / INSULIN mIU/L
INSULIN pmol/L
INSULIN SERPL-ACNC
INSULIN FASTING ECLIA
NÜCHTERNINSULIN (German)
INSULINA EN AYUNAS (Spanish)
INSULINE À JEUN (French)
FASTING INSULIN REFERENCE RANGE 2-25 uIU/mL
FASTING INSULIN REFERENCE RANGE 2.6-24.9 uIU/mL
FAQ about Insulin (Fasting)
-
What is a normal fasting insulin level in µIU/mL?
The standard lab reference range is 2.6–24.9 µIU/mL. Many metabolic health specialists use a stricter optimal range of 2–10 µIU/mL — values above 10 may signal early insulin resistance even when technically within the lab's normal range. The best interpretation pairs your result with fasting glucose, HbA1c, and your overall metabolic risk factors. -
What do µIU/mL, µU/mL, uIU/mL, and uu/ml mean?
These are all the same unit — microinternational units per millilitre — written in different formats. µIU/mL and µU/mL and uIU/mL and uu/ml all refer to the same measurement. mIU/L is also equivalent (1 µIU/mL = 1 mIU/L). If your report shows any of these units, the reference range is the same: 2.6–24.9. -
What does high fasting insulin mean?
High fasting insulin most commonly reflects insulin resistance — your cells respond poorly to insulin and the pancreas compensates by producing more. This usually rises years before fasting glucose becomes abnormal. Common causes include abdominal obesity, sedentary lifestyle, high refined carbohydrate intake, poor sleep, PCOS, and chronic stress. -
What does low fasting insulin mean?
Low fasting insulin (below 2–3 µIU/mL) most commonly reflects excellent insulin sensitivity — a positive finding in lean, active individuals or those on low-carbohydrate diets. It can also indicate reduced insulin production in type 1 diabetes or advanced type 2 diabetes. Low insulin with normal glucose is usually reassuring; low insulin with elevated glucose warrants evaluation. -
What is a good or optimal fasting insulin level?
Most metabolic health specialists consider 2–10 µIU/mL as optimal, with the lower part of this range (2–6 µIU/mL) reflecting the best insulin sensitivity. The lab reference range extends to 24.9 µIU/mL — but being "within range" does not mean insulin metabolism is optimal. Values above 10 µIU/mL in the presence of other metabolic risk factors are worth discussing with your doctor. -
How do I convert fasting insulin from pmol/L to µIU/mL?
The conversion factor for insulin between µIU/mL and pmol/L is debated. Many online calculators use 6.945, but published insulin standardisation research supports 6.00 pmol/L per µIU/mL for human insulin. Because the factor varies by assay and lab convention, always compare your result against the reference range printed on your own report. Approximate pmol/L equivalents using the 6.00 factor: reference range ~16–149 pmol/L; optimal range ~12–60 pmol/L. Using 6.945: reference range ~18–173 pmol/L; optimal ~14–70 pmol/L. -
What does fasting insulin 2.6–24.9 uIU/mL mean?
This is the standard lab reference range for fasting insulin. A result anywhere within 2.6–24.9 µIU/mL is within the laboratory's normal range. However, many clinicians use a stricter optimal range of 2–10 µIU/mL. A result of, say, 18 µIU/mL is within the lab range but would be considered elevated in a functional medicine context. -
Can I have insulin resistance with normal fasting glucose?
Yes — this is one of the most important points about fasting insulin. In early insulin resistance, the pancreas compensates by producing more insulin to keep glucose normal. Fasting insulin rises while fasting glucose remains completely normal. A fasting insulin of 15–20 µIU/mL with normal fasting glucose is a classic pattern of compensated insulin resistance — the early warning window before blood sugar abnormalities develop. -
What is HOMA-IR and how does it relate to fasting insulin?
HOMA-IR is calculated from fasting insulin and fasting glucose: (insulin µIU/mL × glucose mg/dL) ÷ 405. It provides a composite estimate of insulin resistance. A high fasting insulin directly raises the HOMA-IR score. HOMA-IR below 1.0 generally reflects good insulin sensitivity; above 2.0–2.5 suggests insulin resistance in most populations. See the dedicated HOMA-IR page for full interpretation. -
How long do I need to fast before the test?
A minimum of 8 hours is required, ideally 10–12 hours. Water is permitted. Even small amounts of food — including coffee with milk — can transiently raise insulin and invalidate the result. For consistent trend tracking, testing under the same conditions (same fasting duration, same time of day) is helpful. -
Can lifestyle changes lower fasting insulin?
Yes — fasting insulin is highly responsive to lifestyle intervention. Regular physical activity (especially resistance training), reducing refined carbohydrates and ultra-processed foods, improving sleep, managing chronic stress, and achieving a healthy body weight all consistently lower fasting insulin. It is one of the most useful markers for tracking metabolic response to lifestyle changes.
Lab Results Explained and Tracked
What does it mean if your Insulin (Fasting) result is too high?
Elevated fasting insulin — above 10 µIU/mL functionally or above 24.9 µIU/mL by lab reference — most commonly reflects insulin resistance. Your cells have become less responsive to insulin and the pancreas is compensating by producing more to maintain normal blood sugar.
This often precedes elevated blood glucose by years. Most people with high fasting insulin still have completely normal fasting glucose and HbA1c. The pancreas is compensating — but this compensation is unsustainable long-term.
Common causes: Insulin resistance (most common), abdominal obesity, sedentary lifestyle, high refined carbohydrate intake, poor sleep, chronic stress, PCOS, NAFLD, metabolic syndrome, and corticosteroid use.
What to do: High fasting insulin is highly responsive to lifestyle intervention. Reducing refined carbohydrates, increasing physical activity (especially resistance training), improving sleep, and reducing chronic stress consistently lower fasting insulin. Follow up with fasting glucose, HbA1c, triglycerides, HDL, and HOMA-IR for the full metabolic picture.
Related Health Conditions

All Your Lab Results.
One Simple Dashboard.
Import, Track, and Share Your Lab Results Easily
Import, Track, and Share Your Lab Results
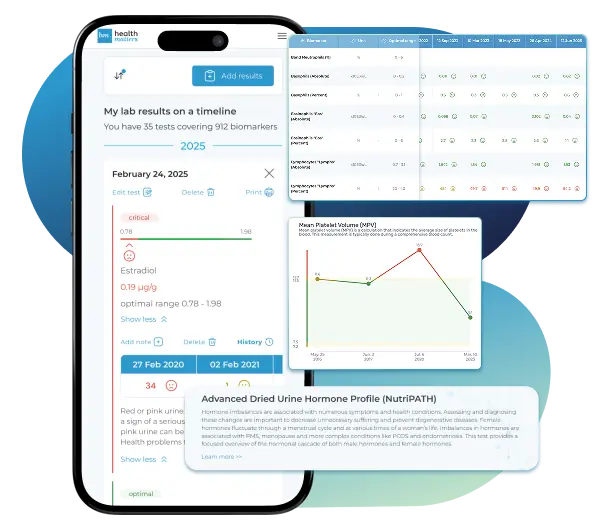
Import lab results from multiple providers, track changes over time, customize your reference ranges, and get clear explanations for each result. Everything is stored securely, exportable in one organized file, and shareable with your doctor—or anyone you choose.
Cancel or upgrade anytime
What does it mean if your Insulin (Fasting) result is too low?
Low fasting insulin — below 2–3 µIU/mL — means the pancreas is producing minimal background insulin. Clinical significance depends on context.
In a healthy, active individual: Low fasting insulin is a positive finding. Lean, physically active people and those on low-carbohydrate diets commonly have low fasting insulin, reflecting excellent insulin sensitivity.
In someone with diabetes: Very low fasting insulin may reflect inadequate beta cell production — either from type 1 diabetes or advanced type 2 diabetes — requiring medical evaluation and management.
Key question: What is your fasting glucose? Low insulin with normal fasting glucose and HbA1c is almost always favourable. Low insulin with elevated fasting glucose warrants evaluation for beta cell insufficiency.
Related Biomarkers
Article Review & Sources
All our content is backed by peer-reviewed studies, academic research, and trusted medical sources. We're committed to accuracy and transparency — see our editorial policy for details.
Laboratories
Bring All Your Lab Results Together — In One Place
We accept reports from any lab, so you can easily collect and organize all your health information in one secure spot.











Pricing Table
Gather Your Lab History — and Finally Make Sense of It
Finally, Your Lab Results Organized and Clear

Personal plans

$79/ year
Advanced Plan
Access your lab reports, explanations, and tracking tools.
- Import lab results from any provider
- Track all results with visual tools
- Customize your reference ranges
- Export your full lab history anytime
- Share results securely with anyone
- Receive 5 reports entered for you
- Cancel or upgrade anytime
$250/ once
Unlimited Account
Pay once, access everything—no monthly fees, no limits.
- Import lab results from any provider
- Track all results with visual tools
- Customize your reference ranges
- Export your full lab history anytime
- Share results securely with anyone
- Receive 10 reports entered for you
- No subscriptions. No extra fees.
$45/ month
Pro Monthly
Designed for professionals managing their clients' lab reports
- Import lab results from any provider
- Track lab results for multiple clients
- Customize reference ranges per client
- Export lab histories and reports
- Begin with first report entered by us
- Cancel or upgrade anytime
About membership
What's included in a Healthmatters membership
 Import Lab Results from Any Source
 See Your Health Timeline
 Understand What Your Results Mean

 Visualize Your Results

 Data Entry Service for Your Reports
 Securely Share With Anyone You Trust
Let Your Lab Results Tell the Full Story
Once your results are in one place, see the bigger picture — track trends over time, compare data side by side, export your full history, and share securely with anyone you trust.




Bring all your results together to compare, track progress, export your history, and share securely.
What Healthmatters Members Are Saying

I have been using Healthmatters.io since 2021. I travel all over the world and use different doctors and health facilities. This site has allowed me to consolidate all my various test results over 14 years in one place. And every doctor that I show this to has been impressed. Because with any health professional I talk to, I can pull up historical results in seconds. It is invaluable. Even going back to the same doctor, they usually do not have the historical results from their facility in a graph format. That has been very helpful.
Anthony
Unlimited Plan Member since 2021
What fantastic service and great, easy-to-follow layouts! I love your website; it makes it so helpful to see patterns in my health data. It's truly a pleasure to use. I only wish the NHS was as organized and quick as Healthmatters.io. You've set a new standard for health tracking!
Karin
Advanced Plan Member since 2020
As a PRO member and medical practitioner, Healthmatters.io has been an invaluable tool for tracking my clients' data. The layout is intuitive, making it easy to monitor trends and spot patterns over time. The ability to customize reports and charts helps me present information clearly to my clients, improving communication and outcomes. It's streamlined my workflow, saving me time and providing insights at a glance. Highly recommended for any practitioner looking for a comprehensive and user-friendly solution to track patient labs!
Paul
Healthmatters Pro Member since 2024

We implement proven measures to keep your data safe.
At HealthMatters, we're committed to maintaining the security and confidentiality of your personal information. We've put industry-leading security standards in place to help protect against the loss, misuse, or alteration of the information under our control. We use procedural, physical, and electronic security methods designed to prevent unauthorized people from getting access to this information. Our internal code of conduct adds additional privacy protection. All data is backed up multiple times a day and encrypted using SSL certificates. See our Privacy Policy for more details.