What does an elevated Insulin Resistance Score mean?
An elevated Insulin Resistance Score most commonly suggests that your body requires more insulin than expected to manage blood sugar. This usually reflects reduced insulin sensitivity and increased metabolic risk.
Common patterns linked to an elevated score include:
-
Early insulin resistance (even if fasting glucose is still normal)
-
Increased risk of prediabetes over time
-
Metabolic syndrome (abdominal weight gain, blood pressure changes, abnormal lipids)
-
Higher triglycerides and/or lower HDL cholesterol
-
Non-alcoholic fatty liver disease (NAFLD)
-
PCOS in women (can occur even in lean individuals)
-
Higher long-term risk of type 2 diabetes and cardiovascular disease
Why insulin resistance can matter even when glucose is “normal”
Insulin resistance can exist long before glucose numbers become abnormal.
In early stages, the pancreas can often “keep up” by producing extra insulin. That means:
A common progression over time:
-
Insulin rises (compensation)
-
Post-meal glucose starts to rise (early dysregulation)
-
Fasting glucose and HbA1c rise (prediabetes)
-
Beta-cell fatigue develops (insulin production begins to fail)
-
Type 2 diabetes may develop
This is why an elevated Insulin Resistance Score can be valuable: it may detect risk earlier, when lifestyle changes tend to be most effective.
Symptoms associated with insulin resistance
Insulin resistance can be present with no symptoms, especially early on. But some people experience:
-
Increased hunger or frequent cravings (especially carbs/sweets)
-
Feeling tired or sleepy after meals
-
Energy crashes or brain fog (often in the afternoon)
-
Difficulty losing weight despite diet and exercise
-
Weight gain around the midsection
-
Darkened skin patches (acanthosis nigricans)
-
Increased thirst or frequent urination (more common later, when glucose rises)
-
In women: irregular periods, acne, or increased facial/body hair (PCOS pattern)
Common causes and contributing factors
Insulin resistance is influenced by genetics, lifestyle, and overall health.
Common drivers include:
-
Excess visceral fat (fat around the organs)
-
Low physical activity and reduced muscle mass
-
High intake of ultra-processed foods and refined carbohydrates
-
Poor sleep quality or sleep apnea
-
Chronic stress and elevated cortisol
-
Certain medications (especially steroids)
-
Hormonal shifts (for example, menopause)
-
Chronic inflammation
-
Fatty liver
-
Family history of type 2 diabetes
Important note: insulin resistance can occur in people who are not overweight. Genetics, muscle mass, sleep, and activity level can still play major roles.
Best labs to review alongside an elevated Insulin Resistance Score
Because this is a summary marker, it becomes much more meaningful when interpreted with related tests such as:
-
Fasting glucose
-
HbA1c
-
Fasting insulin (or intact insulin if available)
-
C-peptide (shows how much insulin your body is producing)
-
Triglycerides and HDL cholesterol
-
ALT and AST (liver enzymes, can reflect fatty liver risk)
-
hsCRP (inflammation marker often elevated with metabolic dysfunction)
-
Blood pressure and waist circumference
-
Oral glucose tolerance test (OGTT), ideally with insulin measurements
A common insulin resistance pattern looks like:
Even small shifts across multiple markers can be meaningful when they move together.
What to do next if your Insulin Resistance Score is elevated
The next step is confirming the bigger metabolic picture and determining whether this is an early (often reversible) stage or a more advanced stage that needs closer follow-up.
Practical steps that often improve insulin sensitivity
1) Strength training and muscle-building
Resistance training improves insulin sensitivity because muscle helps absorb glucose efficiently. Even 2–4 sessions per week can make a measurable difference.
2) Regular movement after meals
A 10–20 minute walk after eating can improve post-meal glucose handling and reduce insulin demand.
3) Improve carbohydrate quality and timing
Many people do better with:
-
More fiber-rich carbohydrates (vegetables, legumes, whole grains if tolerated)
-
Less refined starch and sugar
-
Balanced meals with protein and healthy fats
This doesn’t always require eliminating carbs, but quality and portion size matter.
4) Prioritize protein at meals
Protein supports lean muscle mass, improves satiety, and can reduce cravings—helping improve insulin sensitivity over time.
5) Improve sleep and recovery
Poor sleep increases insulin resistance and appetite signals. If sleep apnea is possible, addressing it can significantly improve metabolic markers.
6) Reduce alcohol and ultra-processed foods
Even modest reductions can improve triglycerides, liver markers, and insulin sensitivity.
7) Track progress over time
Insulin resistance often improves gradually. Rechecking in 8–12 weeks can show meaningful improvement when changes are consistent.
Medical options (when appropriate)
Depending on your overall risk profile, your clinician may discuss:
-
Metformin (commonly used for insulin resistance and prediabetes)
-
GLP-1 receptor agonists (may support weight and metabolic improvement)
-
Treating underlying contributors (fatty liver, sleep apnea, hormonal imbalances)
Medication decisions should always be individualized and based on your full clinical picture.
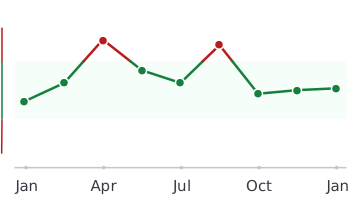
Why trends matter more than one result
Insulin resistance is dynamic. A single elevated score can be influenced by:
For that reason, tracking trends over time and looking at the full metabolic pattern is usually more informative than any single number.
A score below 33 is optimal. The insulin resistance score correlates with steady state glucose levels achieved during an insulin suppression test, a standard research test for insulin resistance. The score is based on insulin and C-peptide results.
The Insulin Resistance Score, a pivotal metric in the realm of metabolic health, serves as a critical tool for assessing the body's sensitivity to insulin and identifying the risk of developing conditions like type 2 diabetes, cardiovascular disease, and metabolic syndrome.

 Insulin Resistance Score