
% CD 8 Pos. Lymph.

Sample type: Blood
Optimal result: 12 – 35.5 %

An elevated percentage of CD8+ positive lymphocytes (% CD8+ Pos. Lymph.) typically indicates an increase in the proportion of a specific type of immune cell called CD8+ T cells in the bloodstream or in a tissue sample, such as from a blood test or a biopsy. CD8+ T cells, also known as cytotoxic T cells or killer T cells, play a crucial role in the immune response by targeting and destroying cells that have been infected by viruses, bacteria, or other pathogens, as well as cells that have become cancerous.

An elevation in the percentage of CD8+ T cells could suggest several things:

  1. Viral Infections: CD8+ T cells are a key component of the body's defense against viral infections. An increase in their percentage could indicate an ongoing or recent viral infection.

  2. Bacterial Infections: While CD8+ T cells are more commonly associated with viral infections, they can also be involved in responses to certain bacterial infections.

  3. Autoimmune Diseases: Some autoimmune diseases involve an overactive immune response where CD8+ T cells may contribute to tissue damage. An increase in CD8+ T cells might be observed in conditions like psoriasis, multiple sclerosis, or type 1 diabetes.

  4. Cancer: CD8+ T cells are important in recognizing and eliminating cancer cells. An elevated percentage of CD8+ T cells might be seen in response to the body's attempt to combat cancer.

  5. Immunological Responses: An elevation might be part of a normal immune response to an antigen challenge or immune activation due to various factors.

It's important to note that interpreting this result would require additional clinical context.

Decreased levels of % CD 8 Pos. Lymph. in a T + B-Lymphocyte Differential panel indicate a lower count of CD8 positive T-cells in the blood. This can be significant as CD8 cells are important for immune response, especially in targeting and destroying virus-infected and cancerous cells. Reduced CD8 levels may be seen in advanced stages of HIV infection, after receiving immunosuppressive therapy, or in certain genetic immunodeficiency disorders. Low CD8 counts can lead to a weakened immune response, making the body more susceptible to infections and diseases. As with all medical tests, these results should be interpreted in the context of the patient's overall health and in consultation with healthcare professionals.

The proportion of all T cells that are CD8 cells.

CD8 cells are also called cytotoxic T-lymphocytes. They help fight cancer and germs that live inside your cells (intracellular pathogens).

The CD8 percentage is sometimes more reliable than the absolute count of CD8 because it tends to vary less.

The biomarker "% CD 8 Pos. Lymph." in a T + B-Lymphocyte Differential panel from Labcorp measures the percentage of lymphocytes in the blood that express the CD8 marker. CD8 positive lymphocytes, also known as cytotoxic T cells, play a vital role in the immune system's defense against pathogens and cancer cells. They are responsible for directly killing virus-infected cells and tumor cells. Alterations in the percentage of CD8 positive lymphocytes can be indicative of various conditions. Elevated levels may occur in response to viral infections, certain autoimmune diseases, or lymphoproliferative disorders. Conversely, decreased levels can be seen in advanced HIV infection, following immunosuppressive therapy, or in certain genetic immunodeficiency disorders. The assessment of CD8 positive lymphocytes is crucial for understanding the immune system's status and function, particularly in the diagnosis and monitoring of diseases that affect immune cell populations.

% CD 8 Pos. Lymph.
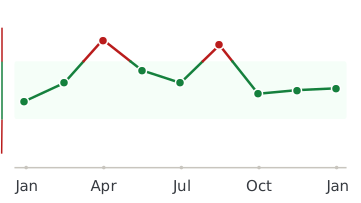
Healthmatters dashboard showing biomarker trend graph

Every lab result you’ve ever had, charted and explained.

Healthmatters is a tracker for your lab results. Upload a report from any lab, any country — every marker charted and explained.

Start with my report →
Beyond % CD 8 Pos. Lymph. — 10,000+ markers explained
One % CD 8 Pos. Lymph. result tells you where you are. Your history tells you where you’re heading. Upload your past lab reports and see this marker — and every marker on them —every marker charted against your own lab’s ranges.
Start with this report →
Healthmatters timeline preview showing biomarker trends over time
Clinical Sources & References

All our content is backed by peer-reviewed studies, academic research, and trusted medical sources. We’re committed to accuracy and transparency — see our editorial policy for details.

Article Review Log
Written by Healthmatters Editorial Team
Healthmatters Lifetime Plan

Pay $250. Track your health forever

One payment. No renewals. Yours for life.

10,000+ biomarkers explained · trends over time

See other plans →
Secure checkout via Stripe · GDPR & HIPAA
We accept results from any lab
LabCorp Quest Diagnostics Genova Diagnostics DUTCH Test Doctor's Data Vibrant America ZRT Laboratory Cyrex Labs + any other lab

What members are saying

★★★★★ 10,000+ happy members
★★★★★

"Watching my numbers move over the years — instead of forgetting last time's results — completely changed how I manage my health."

Daniel
Member since 2022
★★★★★

"Living across several countries made keeping my lab results organized a real challenge. Healthmatters brought my results from the USA, Spain, and Germany together — 20 years of history, with long-term trends instead of scattered reports."

Ben
Member since 2021 · tracks across countries
★★★★★

"Standard lab ranges are too wide for how I practice — 'normal' isn't optimal. I set my own bands, so a client sees yellow before a marker goes officially out of range. That's the conversation I want to be having."

Dr. Alexandra
Functional medicine · 6 yrs on Pro