
2 Hour Specimen

Sample type: Serum

Other names: GTT, Fasting, Two-hour Glucose Tolerance Test, Oral Glucose Tolerance Test

Optimal result: 70 – 140 mg/dL

If the 2-hour blood sugar level in a glucose tolerance test (GTT) is elevated, it indicates that your body is not processing glucose as efficiently as it should, which can be a sign of impaired glucose tolerance or diabetes.

The specific benchmarks for evaluating the 2-hour blood sugar level are as follows:

→ Normal Glucose Tolerance: A 2-hour blood sugar level less than 140 mg/dL is considered normal.

→ Impaired Glucose Tolerance (Pre-diabetes): If the 2-hour blood sugar level is between 140 and 199 mg/dL, it suggests impaired glucose tolerance. This is a pre-diabetic state, which means you're at an increased risk of developing type 2 diabetes, but you don't have the condition yet.

→ Diabetes: A 2-hour blood sugar level of 200 mg/dL or higher suggests diabetes.

An elevated 2-hour blood sugar level in a GTT is significant because it shows how your body is managing glucose over a period, which is crucial in diagnosing diabetes. If you have an elevated 2-hour blood sugar level, your healthcare provider will likely recommend additional tests to confirm the diagnosis of diabetes or pre-diabetes. They may also discuss with you the potential risk factors, lifestyle modifications, and possibly medications to help manage or reduce the risk of developing diabetes.

It's important to understand that an elevated reading in a GTT doesn't necessarily mean you have diabetes; it's a signal that further evaluation is needed. Lifestyle factors like diet and exercise, as well as family history and other health conditions, play a significant role in blood sugar regulation and should be considered in the overall assessment and management plan.

If the 2-hour blood sugar level in a glucose tolerance test (GTT) is significantly low, it may indicate a condition called reactive hypoglycemia. This condition occurs when your blood sugar drops excessively after eating. Normally, the body regulates blood glucose levels efficiently, but in reactive hypoglycemia, this regulation is disrupted, leading to a rapid decline in blood sugar levels after carbohydrate intake.

A 2-hour blood sugar level that is lower than normal can be concerning, especially if it falls below 70 mg/dL, which is generally considered hypoglycemic (low blood sugar). Symptoms of hypoglycemia can include dizziness, sweating, confusion, shakiness, and in severe cases, loss of consciousness.

It's important to note that isolated GTT results are not sufficient to diagnose reactive hypoglycemia or any other condition definitively. If you experience a low reading on a GTT, further evaluation is necessary. This might include monitoring your blood sugar levels more frequently, dietary assessments, and possibly repeating the test. Your healthcare provider will consider your overall health, symptoms, and medical history to determine the cause of the low blood sugar level and appropriate treatment.

In some cases, low blood sugar levels during a GTT can be attributed to other factors, such as the body's overcompensation in insulin production after a high sugar intake, recent changes in diet or medication, or an underlying health condition. Therefore, a comprehensive evaluation by a healthcare professional is crucial for accurate interpretation and management.

The 2-hour blood sugar level in a glucose tolerance test (GTT) is a critical marker for assessing glucose metabolism and diagnosing conditions like diabetes and pre-diabetes. This test is a cornerstone in diabetes management and is especially vital during pregnancy to screen for gestational diabetes. After fasting overnight, your initial blood sugar level is measured. Then, you consume a glucose-rich drink, and your blood sugar levels are tested again at various intervals, with the 2-hour mark being particularly significant. Under normal circumstances, the body efficiently processes the glucose, and blood sugar levels should fall back to less than 140 mg/dL within 2 hours.

If the 2-hour blood sugar level in a glucose tolerance test (GTT) is significantly low, it may indicate a condition called reactive hypoglycemia. This condition occurs when your blood sugar drops excessively after eating. Normally, the body regulates blood glucose levels efficiently, but in reactive hypoglycemia, this regulation is disrupted, leading to a rapid decline in blood sugar levels after carbohydrate intake.

The 2-hour blood sugar level in a glucose tolerance test (GTT) is a critical marker for assessing glucose metabolism and diagnosing conditions like diabetes and pre-diabetes. This test is a cornerstone in diabetes management and is especially vital during pregnancy to screen for gestational diabetes. After fasting overnight, your initial blood sugar level is measured. Then, you consume a glucose-rich drink, and your blood sugar levels are tested again at various intervals, with the 2-hour mark being particularly significant. Under normal circumstances, the body efficiently processes the glucose, and blood sugar levels should fall back to less than 140 mg/dL within 2 hours. A reading between 140 and 199 mg/dL indicates pre-diabetes, known as impaired glucose tolerance, signaling a higher risk of developing type 2 diabetes in the future. A level of 200 mg/dL or more suggests diabetes, necessitating further investigation and management. These values, though generally standard, can vary slightly depending on the laboratory norms and the specific testing protocols used. The GTT, with its focus on the 2-hour blood sugar level, is instrumental in providing a clear picture of how your body handles glucose, guiding healthcare professionals in early detection, prevention strategies, and managing potential complications related to abnormal glucose metabolism. Understanding and monitoring the 2-hour blood sugar level in a GTT is crucial for anyone at risk of or currently managing diabetes, making it a topic of high interest for individuals seeking information on health, wellness, and chronic disease management.

-----------------------

References:

Alberti KG, Zimmet PZ. Definition, diagnosis and classification of diabetes mellitus and its complications. Part 1: diagnosis and classification of diabetes mellitus provisional report of a WHO consultation. Diabet Med. 1998 Jul;15(7):539-53. doi: 10.1002/(SICI)1096-9136(199807)15:7<539::AID-DIA668>3.0.CO;2-S. PMID: 9686693.

Standards of medical care in diabetes--2015: summary of revisions. Diabetes Care. 2015 Jan;38 Suppl:S4. doi: 10.2337/dc15-S003. PMID: 25537706.

Forest JC, Garrido-Russo M, Lemay A, Carrier R, Dube JL. Reference values for the oral glucose tolerance test at each trimester of pregnancy. Am J Clin Pathol. 1983 Dec;80(6):828-31. doi: 10.1093/ajcp/80.6.828. PMID: 6356879.

Hare JW. Gestational diabetes mellitus. Levels of glycemia as management goals. Diabetes. 1991 Dec;40 Suppl 2:193-6. doi: 10.2337/diab.40.2.s193. PMID: 1748258.

Lindsay MK, Graves W, Klein L. The relationship of one abnormal glucose tolerance test value and pregnancy complications. Obstet Gynecol. 1989 Jan;73(1):103-6. PMID: 2909030.

Neiger R, Coustan DR. The role of repeat glucose tolerance tests in the diagnosis of gestational diabetes. Am J Obstet Gynecol. 1991 Oct;165(4 Pt 1):787-90. doi: 10.1016/0002-9378(91)90418-q. PMID: 1951534.

Phelps G, Chapman I, Hall P, Braund W, Mackinnon M. Prevalence of genetic haemochromatosis among diabetic patients. Lancet. 1989 Jul 29;2(8657):233-4. doi: 10.1016/s0140-6736(89)90426-1. PMID: 2569052.

Singer DE, Coley CM, Samet JH, Nathan DM. Tests of glycemia in diabetes mellitus. Their use in establishing a diagnosis and in treatment. Ann Intern Med. 1989 Jan 15;110(2):125-37. doi: 10.7326/0003-4819-110-2-125. PMID: 2642375.

2 Hour Specimen
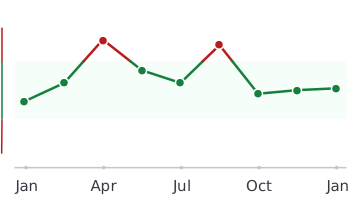
Healthmatters dashboard showing biomarker trend graph

Every lab result you’ve ever had, charted and explained.

Healthmatters is a tracker for your lab results. Upload a report from any lab, any country — every marker charted and explained.

Start with my report →
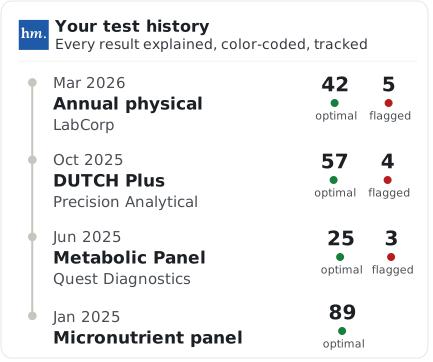
Beyond 2 Hour Specimen — 10,000+ markers explained
One 2 Hour Specimen result tells you where you are. Your history tells you where you’re heading. Upload your past lab reports and see this marker — and every marker on them —every marker charted against your own lab’s ranges.
Start with this report →
Healthmatters timeline preview showing biomarker trends over time
Clinical Sources & References

All our content is backed by peer-reviewed studies, academic research, and trusted medical sources. We’re committed to accuracy and transparency — see our editorial policy for details.

Article Review Log
Written by Healthmatters Editorial Team
Healthmatters Lifetime Plan

Pay $250. Track your health forever

One payment. No renewals. Yours for life.

10,000+ biomarkers explained · trends over time

See other plans →
Secure checkout via Stripe · GDPR & HIPAA
We accept results from any lab
LabCorp Quest Diagnostics Genova Diagnostics DUTCH Test Doctor's Data Vibrant America ZRT Laboratory Cyrex Labs + any other lab

What members are saying

★★★★★ 10,000+ happy members
★★★★★

"Watching my numbers move over the years — instead of forgetting last time's results — completely changed how I manage my health."

Daniel
Member since 2022
★★★★★

"Living across several countries made keeping my lab results organized a real challenge. Healthmatters brought my results from the USA, Spain, and Germany together — 20 years of history, with long-term trends instead of scattered reports."

Ben
Member since 2021 · tracks across countries
★★★★★

"Standard lab ranges are too wide for how I practice — 'normal' isn't optimal. I set my own bands, so a client sees yellow before a marker goes officially out of range. That's the conversation I want to be having."

Dr. Alexandra
Functional medicine · 6 yrs on Pro