
Vanadium

Optimal result: 0.04 – 0.3 ug/L

Vanadium is not currently considered an essential nutrient cofactor for any human enzyme, although it is essential for some rodents (rats). Vanadium may improve insulin responses and blood sugar control; Wang et al. (2014) found an inverse correlation in new type II Chinese diabetics and plasma V levels. The subjects with the lowest levels of V had the highest risk of diabetes.

Accumulating evidence suggests that the presence or absence of V may alter immune responses, particularly humoral immunity (B cell responses). A study of industrial workers indicates that low levels of V may be associated with increased risk for atherosclerosis (higher cholesterol, lower HDL-C, poor apoB / apoA1 ratios); this association was strongest in males. Very little V is found in red blood cells.

The oxidation state of V may determine whether it is found in the cell or the plasma. Vanadium (IV) diffuses through cell membranes, while V enters cells via anionic channels. Intracellular V is found primarily in the kidneys, spleen, bones and liver, and is typically found as vanadium (IV) or V. In the plasma, V is primarily bound to transferrin, albumin or serum lipids.

Normal serum concentrations in unexposed human populations average less than 1û2 µg V/L.

Consider:

-Evaluate digestion and absorption (Comprehensive Stool Analysis)

-Evaluate diet. Food sources of V include: mushrooms, shellfish, black pepper, parsley, dill weed, grain and grain products.

Some studies suggest vanadium has a role in glucose and lipid metabolism, red blood cell formation, and thyroid function. Vanadium assessment and treatment may be indicated in cases of metabolic syndrome or non-insulindependent diabetes mellitus due to vanadium’s role in insulin sensitization. Symptoms that appear to be associated with excessive vanadium are hypertension, decreased coenzymes A and Q10, bipolar disorder, and disruption of energy metabolism. Exposure to vanadium in air or water is of concern for those exposed to vanadium industrial plants. Symptoms may include respiratory disorders, green tongue, high urinary excretion of vanadium, and reduced neurobehavioral abilities. Urine vanadium is traditionally used to assess occupational exposure. Whole blood vanadium has been shown to significantly differentiate children with vanadium exposure from non-exposed children but authors stated that hair levels of vanadium did not significantly correlate with vanadium exposure. This may have to do with distinction of acute versus chronic exposure.

Some studies suggest vanadium has a role in glucose and lipid metabolism, red blood cell formation, and thyroid function. Vanadium assessment and treatment may be indicated in cases of metabolic syndrome or non-insulindependent diabetes mellitus due to vanadium’s role in insulin sensitization. Symptoms that appear to be associated with excessive vanadium are hypertension, decreased coenzymes A and Q10, bipolar disorder, and disruption of energy metabolism. Exposure to vanadium in air or water is of concern for those exposed to vanadium industrial plants. Symptoms may include respiratory disorders, green tongue, high urinary excretion of vanadium, and reduced neurobehavioral abilities. Urine vanadium is traditionally used to assess occupational exposure. Whole blood vanadium has been shown to significantly differentiate children with vanadium exposure from non-exposed children but authors stated that hair levels of vanadium did not significantly correlate with vanadium exposure. This may have to do with distinction of acute versus chronic exposure.

Vanadium
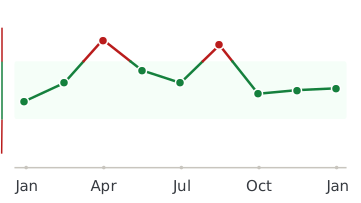
Healthmatters dashboard showing biomarker trend graph

Every lab result you’ve ever had, charted and explained.

Healthmatters is a tracker for your lab results. Upload a report from any lab, any country — every marker charted and explained.

Start with my report →
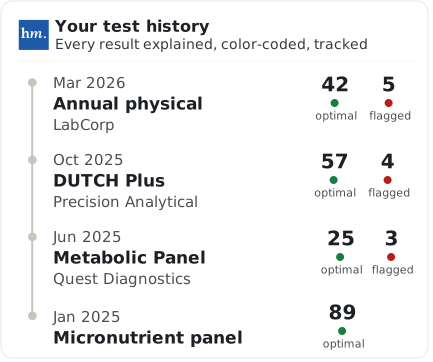
Beyond Vanadium — 10,000+ markers explained
One Vanadium result tells you where you are. Your history tells you where you’re heading. Upload your past lab reports and see this marker — and every marker on them —every marker charted against your own lab’s ranges.
Start with this report →
Healthmatters timeline preview showing biomarker trends over time
Clinical Sources & References

All our content is backed by peer-reviewed studies, academic research, and trusted medical sources. We’re committed to accuracy and transparency — see our editorial policy for details.

Article Review Log
Written by Healthmatters Editorial Team
Healthmatters Lifetime Plan

Pay $250. Track your health forever

One payment. No renewals. Yours for life.

10,000+ biomarkers explained · trends over time

See other plans →
Secure checkout via Stripe · GDPR & HIPAA
We accept results from any lab
LabCorp Quest Diagnostics Genova Diagnostics DUTCH Test Doctor's Data Vibrant America ZRT Laboratory Cyrex Labs + any other lab

What members are saying

★★★★★ 10,000+ happy members
★★★★★

"Watching my numbers move over the years — instead of forgetting last time's results — completely changed how I manage my health."

Daniel
Member since 2022
★★★★★

"Living across several countries made keeping my lab results organized a real challenge. Healthmatters brought my results from the USA, Spain, and Germany together — 20 years of history, with long-term trends instead of scattered reports."

Ben
Member since 2021 · tracks across countries
★★★★★

"Standard lab ranges are too wide for how I practice — 'normal' isn't optimal. I set my own bands, so a client sees yellow before a marker goes officially out of range. That's the conversation I want to be having."

Dr. Alexandra
Functional medicine · 6 yrs on Pro