
SAM/SAH Ratio

Optimal result: 4 – 20 Ratio

Elevated SAM/SAH Ratio (SAM elevation):

- Potential Over-methylation: Review genetic markers, such as BHMT, that could lead to higher SAM levels

- Review nutritional supplements that could be contributing to high SAM

- High Protein Intake

- High BMI: Elevated SAM has been correlated to higher BMI, however the degree of impact to SAH is unknown.

Low SAM/SAH Ratio (SAH elevation):

Check SAH and Homocysteine Levels: If elevated, consider nutritional methylation support:

- Vitamins B12

- Vitamin B6

- Folate

- Zinc

- Other methylation support may be considered as well, especially with low levels of betaine and choline.

The SAM/SAH ratio is commonly referred to as the “Methylation Index” in the literature and has well- documented clinical associations.

Global methylation is dependent on two key factors: adequate SAM supply and SAH removal.

The SAM/SAH ratio has been proposed to indicate the likelihood of hyper- or hypo-methylation. 

Overall, the SAM/SAH ratio is under tight homeostatic control. SAM levels remain fairly stable due to denovo synthesis and feedback mechanisms. Given this, alterations in the methylation index are more likely a result of SAH fluctuations.

The SAM/SAH ratio is commonly referred to as the “Methylation Index” in the literature and has well- documented clinical associations.

Global methylation is dependent on two key factors: adequate SAM supply and SAH removal.

The SAM/SAH ratio has been proposed to indicate the likelihood of hyper- or hypo-methylation. 

Overall, the SAM/SAH ratio is under tight homeostatic control. SAM levels remain fairly stable due to denovo synthesis and feedback mechanisms. Given this, alterations in the methylation index are more likely a result of SAH fluctuations.

SAH is a potent inhibitor of methyltransferase reactions, which is likely why SAH elevations and a low methylation index are correlated with global hypo-methylation. Furthermore, poor homocysteine clearance contributes significantly to SAH elevations which provides insight into the relationship between these two analytes and cardiovascular disease.

The SAM/SAH ratio is resistant to fluctuations in independent nutrients, given the interconnectedness of the pathways. SAM remains fairly stable due to de novo synthesis and the liver’s tight control over SAM levels. Therefore, is it more likely that SAH variability will lead to alterations in the methylation index.

Methylation reactions become compromised with a decreased SAM/SAH ratio and as SAH levels become elevated. SAM/SAH ratio abnormalities should be addressed by ensuring adequate dietary methyl donor levels (i.e. methionine, SAM-e) and nutritional cofactors required for clearance of SAH and homocysteine (i.e. B6, B12, and folate).

It is important to note that while the Methylation Panel does not directly measure DNA methylation, the SAM/SAH ratio has been shown to correlate with DNA methylation. Many environmental and lifestyle factors have been shown to affect DNA methylation which can turn on/off gene expression. Exposure to tobacco smoke, arsenic, benzene, radiation, lead, cadmium, nickel and asbestos are all tied to DNA methylation defects. Obesity, lack of physical activity, and shift work have also been shown to alter DNA and histone methylation, and thereby gene expression. Chronic alcohol use is another pertinent lifestyle factor to evaluate as it can cause malabsorption of key B-vitamins necessary for methylation.

SAM/SAH Ratio
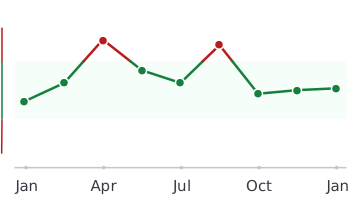
Healthmatters dashboard showing biomarker trend graph

Every lab result you’ve ever had, charted and explained.

Healthmatters is a tracker for your lab results. Upload a report from any lab, any country — every marker charted and explained.

Start with my report →
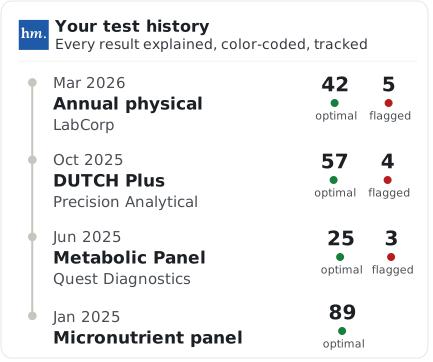
Beyond SAM/SAH Ratio — 10,000+ markers explained
One SAM/SAH Ratio result tells you where you are. Your history tells you where you’re heading. Upload your past lab reports and see this marker — and every marker on them —every marker charted against your own lab’s ranges.
Start with this report →
Healthmatters timeline preview showing biomarker trends over time
Clinical Sources & References

All our content is backed by peer-reviewed studies, academic research, and trusted medical sources. We’re committed to accuracy and transparency — see our editorial policy for details.

Article Review Log
Written by Healthmatters Editorial Team
Healthmatters Lifetime Plan

Pay $250. Track your health forever

One payment. No renewals. Yours for life.

10,000+ biomarkers explained · trends over time

See other plans →
Secure checkout via Stripe · GDPR & HIPAA
We accept results from any lab
LabCorp Quest Diagnostics Genova Diagnostics DUTCH Test Doctor's Data Vibrant America ZRT Laboratory Cyrex Labs + any other lab

What members are saying

★★★★★ 10,000+ happy members
★★★★★

"Watching my numbers move over the years — instead of forgetting last time's results — completely changed how I manage my health."

Daniel
Member since 2022
★★★★★

"Living across several countries made keeping my lab results organized a real challenge. Healthmatters brought my results from the USA, Spain, and Germany together — 20 years of history, with long-term trends instead of scattered reports."

Ben
Member since 2021 · tracks across countries
★★★★★

"Standard lab ranges are too wide for how I practice — 'normal' isn't optimal. I set my own bands, so a client sees yellow before a marker goes officially out of range. That's the conversation I want to be having."

Dr. Alexandra
Functional medicine · 6 yrs on Pro