
m-Hydroxyphenylacetate (3-Hydroxyphenylacetic acid) and 4-hydroxyphenylacetic acid are produced by the bacterial fermentation of amino acids, much like Indoleacetic acid (IAA).
Common Dietary Sources:
Wine/grapes, cranberries, green/black tea, berries, orange juice, grape seed extract
References:
- Mora Brugues J, Gonzalez Sastre F. Influence of intestinal flora on the elimination of phenylacetic acid in urine. Clin Chem. 1986;32(1 Pt 1):223.
- Russell WR, Duncan SH, Scobbie L, et al. Major phenylpropanoidderived metabolites in the human gut can arise from microbial fermentation of protein. Mol Nutr Food Res. 2013;57(3):523-535.
- Sabelli H, Fawcett J, Gusovsky F, Edwards J, Jeffriess H, Javaid J. Phenylacetic acid as an indicator in bipolar affective disorders. J Clin Psychopharmacol. 1983;3(4):268-270.
- Sabelli HC, Fawcett J, Gusovsky F, et al. Clinical studies on the phenylethylamine hypothesis of affective disorder: urine and blood phenylacetic acid and phenylalanine dietary supplements. J Clin Psych. 1986;47(2):66-70.
- Sabelli HC, Javaid JI, Fawcett J, Kravitz HM, Wynn P. Urinary phenylacetic acid in panic disorder with and without depression. Acta Psych Scand. 1990;82(1):14-16.
- Henning SM, Wang P, Abgaryan N, et al. Phenolic acid concentrations in plasma and urine from men consuming green or black tea and potential chemopreventive properties for colon cancer. Mol Nutr Food Res. 2013;57(3):483-493.
- Jacobs DM, Fuhrmann JC, van Dorsten FA, et al. Impact of ShortTerm Intake of Red Wine and Grape Polyphenol Extract on the Human Metabolome. J Agr Food Chem. 2012;60(12):3078-3085.
- Zamora-Ros R, Achaintre D, Rothwell JA, et al. Urinary excretions of 34 dietary polyphenols and their associations with lifestyle factors in the EPIC cohort study. Sci Rep. 2016;6:26905-26905.
- Ward NC, Croft KD, Puddey IB, Hodgson JM. Supplementation with grape seed polyphenols results in increased urinary excretion of 3-hydroxyphenylpropionic Acid, an important metabolite of proanthocyanidins in humans. J Agric Food Chem. 2004;52(17):5545-5549.
- Amic A, Markovic Z, Markovic JMD, Jeremic S, Lucic B, Amic D. Free radical scavenging and COX-2 inhibition by simple colon metabolites of polyphenols: A theoretical approach. Comput Biol Chem. 2016;65:45-53.
- Manach C, Williamson G, Morand C, Scalbert A, Remesy C. Bioavailability and bioefficacy of polyphenols in humans. I. Review of 97 bioavailability studies. Am J Clin Nutr. 2005;81(1 Suppl):230s-242s.
- Selma MV, Espin JC, Tomas-Barberan FA. Interaction between phenolics and gut microbiota: role in human health. J Agric Food Chem. 2009;57(15):6485-6501.
 m-Hydroxyphenylacetate
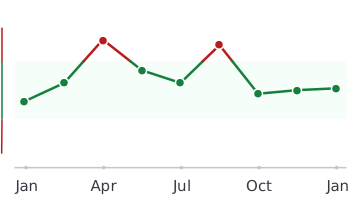
Every lab result you’ve ever had, charted and explained.
Healthmatters is a tracker for your lab results. Upload a report from any lab, any country — every marker charted and explained.
Start with my report →
All our content is backed by peer-reviewed studies, academic research, and trusted medical sources. We’re committed to accuracy and transparency — see our editorial policy for details.