
Hippuric Acid

Optimal result: 198.7 – 3104.6 nmol/mg Creatinine

Increased metabolism by imbalanced gut flora may increase levels. Additionally, dietary intake of polyphenols or food preservatives can also increase levels of these organic acids.

Clinical Associations: Elevated levels of urinary hippuric acid have been associated with several clinical conditions that may be linked to dysbiosis. For example, elevated urinary hippurate was associated with an increase in blood pressure, likely due to the direct effect of gut-microbial products on blood pressure. However, in other studies low hippuric acid excretion has also been attributed to dysbiosis, which supports its use as a biomarker for general microbial alterations.

Low levels of hippurate may occur if there are nutritional enzyme inhibitions or inherited low-activity enzyme variants present in the synthesis pathway, or if there are low levels of its precursor (plant materials). Hippurate is synthesized in the liver and kidney mitochondria from benzoate on a pathway that requires minerals and glycine. A low hippurate level with a higher benzoate level may indicate a glycine insufficiency or a defect in the glycine deportation system. Low levels of hippurate may also occur if the diet is poor in plant compounds or if there are too few beneficial bacteria in the gut. Comorbid conditions that may be associated with lower hippurate levels include inflammatory bowel disease (IBD) parasites, and obesity. Some toxic chemical exposures (hydrazine, methylene dianiline, galactosamine, chlorophenoxyacetic acid herbicides) may also decrease hippurate levels.

→ Low hippurate with increased benzoate may indicate a glycine deficiency or a defect in the glycine deportation system

- If indicated, consider supporting the glycine deportation system with magnesium, manganese (if deficient), potassium, rubidium and glycine.

- Poor methylation may inhibit serine/glycine interconversion. If indicated, consider checking methylation status.

→ Benzoic acid is metabolized to hippuric acid and excreted.

→ Hippuric acid is a normal urinary metabolite associated with microbial degradation of certain dietary components.

→ Levels of hippuric acid rise with the consumption of fruit juice, tea, and wine, which are converted to benzoic acid.

→ Though a defect in the enzymatic conjugation of benzoic to hippuric acid has been noted in Crohn’s disease patients, research implicates altered gut microbial metabolism as the cause of decreased hippuric acid.

→ Other research has found a positive association between Clostridia spp. and hippuric acid levels.

→ Hippuric acid has been positively associated with gut diversity.

→ If elevated, evaluate benzoic acid and glycine levels. Support with glycine if needed.

→ Benzoic acid is metabolized to hippuric acid and excreted.

→ Hippuric acid is a normal urinary metabolite associated with microbial degradation of certain dietary components.

→ Levels of hippuric acid rise with the consumption of fruit juice, tea, and wine, which are converted to benzoic acid.

→ Though a defect in the enzymatic conjugation of benzoic to hippuric acid has been noted in Crohn’s disease patients, research implicates altered gut microbial metabolism as the cause of decreased hippuric acid.

→ Other research has found a positive association between Clostridia spp. and hippuric acid levels.

→ Hippuric acid has been positively associated with gut diversity.

→ If elevated, evaluate benzoic acid and glycine levels. Support with glycine if needed.

Hippuric Acid
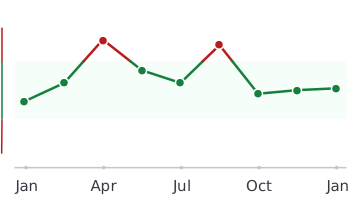
Healthmatters dashboard showing biomarker trend graph

Every lab result you’ve ever had, charted and explained.

Healthmatters is a tracker for your lab results. Upload a report from any lab, any country — every marker charted and explained.

Start with my report →
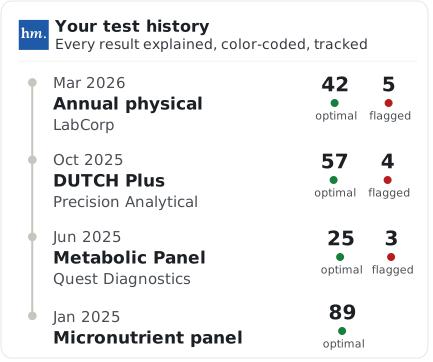
Beyond Hippuric Acid — 10,000+ markers explained
One Hippuric Acid result tells you where you are. Your history tells you where you’re heading. Upload your past lab reports and see this marker — and every marker on them —every marker charted against your own lab’s ranges.
Start with this report →
Healthmatters timeline preview showing biomarker trends over time
Clinical Sources & References

All our content is backed by peer-reviewed studies, academic research, and trusted medical sources. We’re committed to accuracy and transparency — see our editorial policy for details.

Article Review Log
Written by Healthmatters Editorial Team
Healthmatters Lifetime Plan

Pay $250. Track your health forever

One payment. No renewals. Yours for life.

10,000+ biomarkers explained · trends over time

See other plans →
Secure checkout via Stripe · GDPR & HIPAA
We accept results from any lab
LabCorp Quest Diagnostics Genova Diagnostics DUTCH Test Doctor's Data Vibrant America ZRT Laboratory Cyrex Labs + any other lab

What members are saying

★★★★★ 10,000+ happy members
★★★★★

"Watching my numbers move over the years — instead of forgetting last time's results — completely changed how I manage my health."

Daniel
Member since 2022
★★★★★

"Living across several countries made keeping my lab results organized a real challenge. Healthmatters brought my results from the USA, Spain, and Germany together — 20 years of history, with long-term trends instead of scattered reports."

Ben
Member since 2021 · tracks across countries
★★★★★

"Standard lab ranges are too wide for how I practice — 'normal' isn't optimal. I set my own bands, so a client sees yellow before a marker goes officially out of range. That's the conversation I want to be having."

Dr. Alexandra
Functional medicine · 6 yrs on Pro