
Understanding the Calcium/Albumin Ratio on a Comprehensive Metabolic Panel (CMP)
The Calcium/Albumin Ratio is a calculated value derived from total calcium and albumin levels on a Comprehensive Metabolic Panel (CMP). It provides insights into the balance between calcium, a critical mineral for bone health and cellular function, and albumin, a protein that affects calcium availability in the bloodstream.
Why Is the Calcium/Albumin Ratio Important?
Calcium in the blood exists in two forms:
- Bound calcium: Attached to proteins, primarily albumin.
- Free (ionized) calcium: Biologically active and essential for critical functions, such as nerve transmission, muscle contractions, and blood clotting.
Since a significant portion of calcium is bound to albumin, changes in albumin levels can affect total calcium measurements. The Calcium/Albumin Ratio helps assess whether abnormal calcium levels are due to a true calcium imbalance or shifts in albumin levels.
Normal Calcium/Albumin Ratio
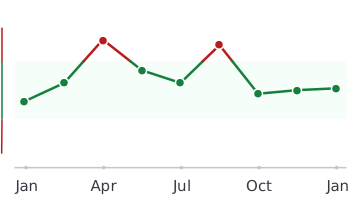
While reference ranges may vary, the typical ratio falls between 2.1 and 2.5. Deviations from this range may indicate an underlying issue that requires further investigation.
Causes of an Elevated Calcium/Albumin Ratio
-
Hypercalcemia (high calcium levels):
- Hyperparathyroidism (overactive parathyroid glands)
- Malignancies (cancer-related calcium release)
- Excessive vitamin D intake
- Prolonged immobilization or certain bone diseases
-
Low albumin levels (hypoalbuminemia):
- Chronic liver disease or cirrhosis
- Kidney disorders causing protein loss (e.g., nephrotic syndrome)
- Malnutrition or inflammation
In cases of hypoalbuminemia, total calcium levels may appear falsely low, making this ratio helpful for identifying actual calcium imbalances.
Causes of a Low Calcium/Albumin Ratio
-
Hypocalcemia (low calcium levels):
- Vitamin D deficiency
- Hypoparathyroidism (underactive parathyroid glands)
- Chronic kidney disease or kidney failure
- Pancreatitis or severe illness
-
High albumin levels (hyperalbuminemia):
- Often due to dehydration or a concentrated blood volume
Clinical Significance
The Calcium/Albumin Ratio is especially useful in:
- Diagnosing metabolic disorders: It can help pinpoint whether abnormal calcium levels are tied to true calcium dysregulation or secondary to albumin changes.
- Guiding treatment: For example, correcting albumin levels or addressing the underlying cause of calcium imbalances.
Optimizing the Calcium/Albumin Ratio
- Balanced nutrition: Ensure adequate calcium and vitamin D intake to support bone and metabolic health.
- Stay hydrated: Dehydration can affect albumin and calcium concentrations.
- Address underlying conditions: Treating liver or kidney disease, managing inflammation, or correcting parathyroid dysfunction can improve imbalances.
In summary, the Calcium/Albumin Ratio is a valuable marker for understanding calcium levels in the context of albumin changes. If your results fall outside the normal range, consult a healthcare provider to evaluate potential causes and develop a tailored plan for correction.
 Calcium/ Albumin Ratio
Every lab result you’ve ever had, charted and explained.
Healthmatters is a tracker for your lab results. Upload a report from any lab, any country — every marker charted and explained.
Start with my report →
All our content is backed by peer-reviewed studies, academic research, and trusted medical sources. We’re committed to accuracy and transparency — see our editorial policy for details.