
a-3 (female)

Sample type: Plasma
Optimal result: 0 – 20 mg/dL

Elevated levels of the α-3 marker in the Boston Heart HDL Map Test signify a potentially lower risk of cardiovascular disease (CVD), as they indicate a strong capacity for reverse cholesterol transport, where cholesterol is effectively removed from the arteries and transported to the liver for excretion. This process helps prevent plaque buildup in the arteries, reducing the risk of atherosclerosis and related cardiovascular events such as heart attacks and strokes. Diagnostically, high α-3 levels are generally considered a positive indicator of cardiovascular health, often resulting from a combination of genetic factors and healthy lifestyle choices, such as regular physical activity, a balanced diet rich in healthy fats, and avoiding smoking. There are typically no direct symptoms associated with elevated α-3 HDL levels, as it is a marker of good health rather than a condition. However, maintaining high levels can be crucial for those at risk of CVD. Treatment options focus on lifestyle modifications to sustain or further improve HDL functionality. These include maintaining a diet low in saturated fats and cholesterol, increasing intake of omega-3 fatty acids, engaging in regular physical exercise, achieving and maintaining a healthy weight, and managing other health conditions such as diabetes and hypertension. Medications like statins or niacin may also be prescribed to help manage overall cholesterol levels and enhance HDL function. Regular monitoring of HDL subpopulations, including α-3, can provide valuable information to tailor preventative and therapeutic strategies for optimal cardiovascular health.

The marker α-3 in the Boston Heart HDL Map Test is one of the specific subpopulations of high-density lipoprotein (HDL) particles measured to assess cardiovascular disease (CVD) risk. HDL particles, often referred to as "good cholesterol," play a crucial role in transporting cholesterol from the arteries to the liver for removal from the body. Among the various HDL subpopulations, α-3 HDL is particularly significant because it is involved in reverse cholesterol transport, a process that helps reduce cholesterol buildup in the arteries and thus lowers the risk of atherosclerosis and heart disease.

What does it mean if the α-3 is "Borderline"?

A borderline elevated result for the α-3 marker in the Boston Heart HDL Map Test indicates that while the levels of this HDL subpopulation are higher than average, they are not significantly high enough to guarantee optimal cardiovascular protection. This means the patient may have some capacity for effective reverse cholesterol transport, which helps remove cholesterol from the arteries and transport it to the liver for excretion, but this capacity is not at its peak.

Borderline elevated α-3 levels suggest that while the risk of cardiovascular disease (CVD) is potentially lower than in individuals with low α-3 levels, it is not as low as in those with markedly high α-3 levels. This intermediate status can be due to various factors, including diet, physical activity, genetics, and overall health conditions such as obesity, diabetes, or smoking habits.

From a diagnostic perspective, a borderline elevated result serves as a warning to reassess and possibly enhance lifestyle habits and medical treatments. The causes can range from partially healthy habits that need improvement to underlying health issues that impact cholesterol metabolism. There are usually no symptoms directly associated with borderline elevated α-3 levels, but the individual may be at a slightly increased risk for CVD compared to those with higher α-3 levels.

Treatment options to improve α-3 HDL levels and overall cardiovascular health include adopting a heart-healthy diet low in saturated fats and cholesterol, increasing physical activity, losing weight if necessary, quitting smoking, and managing stress. In some cases, medications such as statins or niacin might be recommended to improve HDL functionality and overall lipid profile. Regular follow-ups and monitoring of HDL subpopulations can help adjust these interventions effectively to reduce CVD risk.

The marker α-3 in the Boston Heart HDL Map Test is one of the specific subpopulations of high-density lipoprotein (HDL) particles measured to assess cardiovascular disease (CVD) risk. HDL particles, often referred to as "good cholesterol," play a crucial role in transporting cholesterol from the arteries to the liver for removal from the body. Among the various HDL subpopulations, α-3 HDL is particularly significant because it is involved in reverse cholesterol transport, a process that helps reduce cholesterol buildup in the arteries and thus lowers the risk of atherosclerosis and heart disease.

The α-3 marker specifically measures the concentration of apoA-I protein in this HDL subclass. ApoA-I is the main protein component of HDL and is essential for its cholesterol-clearing functions. Elevated levels of α-3 HDL are generally associated with a lower risk of CVD because they indicate a robust capacity for reverse cholesterol transport. Conversely, low levels of α-3 HDL may suggest a diminished ability to remove cholesterol from the bloodstream, potentially leading to plaque buildup in the arteries and increased CVD risk.

By quantifying α-3 HDL levels, the Boston Heart HDL Map Test provides detailed insights into a patient’s cardiovascular health. This information can guide healthcare providers in developing personalized treatment plans, including lifestyle changes and medications to improve HDL functionality and reduce CVD risk. Understanding and monitoring α-3 HDL levels can be a crucial step in proactive heart health management, helping to prevent heart attacks, strokes, and other cardiovascular events.

a-3 (female)
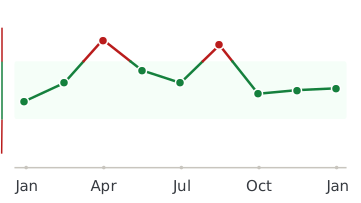
Healthmatters dashboard showing biomarker trend graph

Every lab result you’ve ever had, charted and explained.

Healthmatters is a tracker for your lab results. Upload a report from any lab, any country — every marker charted and explained.

Start with my report →
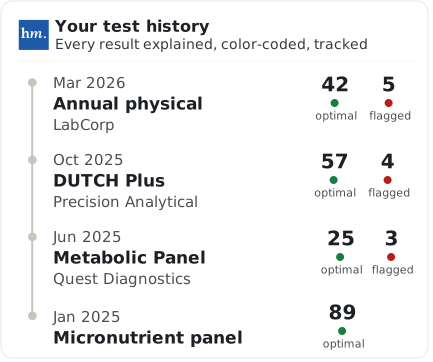
Beyond a-3 (female) — 10,000+ markers explained
One a-3 (female) result tells you where you are. Your history tells you where you’re heading. Upload your past lab reports and see this marker — and every marker on them —every marker charted against your own lab’s ranges.
Start with this report →
Healthmatters timeline preview showing biomarker trends over time
Clinical Sources & References

All our content is backed by peer-reviewed studies, academic research, and trusted medical sources. We’re committed to accuracy and transparency — see our editorial policy for details.

Article Review Log
Written by Healthmatters Editorial Team
Healthmatters Lifetime Plan

Pay $250. Track your health forever

One payment. No renewals. Yours for life.

10,000+ biomarkers explained · trends over time

See other plans →
Secure checkout via Stripe · GDPR & HIPAA
We accept results from any lab
LabCorp Quest Diagnostics Genova Diagnostics DUTCH Test Doctor's Data Vibrant America ZRT Laboratory Cyrex Labs + any other lab

What members are saying

★★★★★ 10,000+ happy members
★★★★★

"Watching my numbers move over the years — instead of forgetting last time's results — completely changed how I manage my health."

Daniel
Member since 2022
★★★★★

"Living across several countries made keeping my lab results organized a real challenge. Healthmatters brought my results from the USA, Spain, and Germany together — 20 years of history, with long-term trends instead of scattered reports."

Ben
Member since 2021 · tracks across countries
★★★★★

"Standard lab ranges are too wide for how I practice — 'normal' isn't optimal. I set my own bands, so a client sees yellow before a marker goes officially out of range. That's the conversation I want to be having."

Dr. Alexandra
Functional medicine · 6 yrs on Pro