
At a Glance
A high urea nitrogen/creatinine ratio does not necessarily mean your BUN is high. A relatively low creatinine can also raise it. Start by finding both numbers on your report.
This is the BUN/creatinine ratio, calculated from blood urea nitrogen and blood creatinine. The reference interval displayed on this page is 9–23. Compare your result with the interval on your own laboratory report.
The ratio describes the relationship between two measurements. It does not measure kidney filtration directly or identify the reason for an abnormal result.
If you remember only one thing
The same ratio can come from very different blood results. Read the BUN and creatinine before interpreting the ratio.
What is being compared?
Blood urea nitrogen (BUN) measures the nitrogen contained in urea, a waste product formed during protein metabolism. Its concentration depends on production and removal, so it can change for reasons beyond kidney filtration. [2,4]
Creatinine is a waste product associated with muscle metabolism. Kidney filtration affects its blood concentration, but so do muscle mass and other factors. A low creatinine can therefore increase the ratio without an increase in BUN. [3]
On standard US reports:
Ratio = BUN in mg/dL ÷ creatinine in mg/dL
For example, BUN of 18 mg/dL divided by creatinine of 0.9 mg/dL gives a ratio of 20. This is a calculation from the component tests, rather than a separate substance measured in your blood. [1]
How to read your result
| Ratio on this page | What it establishes | What to check next |
|---|---|---|
| Below 9 | BUN is lower relative to creatinine than this page's interval allows. | Is BUN low, is creatinine high, or are both contributing? |
| 9–23 | The relationship falls within this page's interval. | Are the component values and their trends concerning, even though the ratio is in range? |
| Above 23 | BUN is higher relative to creatinine than this page's interval allows. | Is BUN high, is creatinine low, or are both contributing? |
These boundaries describe the displayed reference interval. They are not thresholds that diagnose dehydration, kidney injury or liver disease.
When the ratio is high
Dehydration or reduced blood flow to the kidneys can increase BUN relative to creatinine. However, higher protein intake, increased protein breakdown, certain medicines and bleeding in the digestive tract can also affect the relationship. Reduced muscle mass can lower creatinine and raise the ratio through a different route. [2–4]
The useful question is therefore not simply “Am I dehydrated?” It is “Which component changed, and what could explain that change?”
When the ratio is low
Lower BUN can occur with low protein intake or liver disease. Alternatively, creatinine may be relatively high. Kidney filtration and muscle-related factors need consideration when interpreting that result. Neither pattern identifies a cause on its own. [2–4]
When the ratio is in range
An in-range ratio does not establish normal kidney function. BUN and creatinine can rise together while their quotient stays within the interval. Kidney assessment also uses creatinine trends, an appropriate estimated glomerular filtration rate (eGFR), and urine findings such as albumin. [5]
Two people, same result
Consider two hypothetical reports, both using mg/dL for the component values:
| Report | BUN | Creatinine | Calculated ratio |
|---|---|---|---|
| A | 12 | 0.4 | 30 |
| B | 60 | 2.0 | 30 |
Both ratios are above this page's interval. The underlying results are very different.
In report A, the small denominator contributes to the high ratio. In report B, the component concentrations are much higher. The ratio does not distinguish those situations or establish either person's diagnosis. The examples illustrate arithmetic, not expected results for a particular disease.
What this test cannot tell you
It cannot confirm dehydration. A study of adults with elevated creatinine assessed in an emergency department found that the ratio did not reliably distinguish reduced kidney blood flow from intrinsic kidney injury. That finding concerns that clinical setting; it does not make the ratio useless in every assessment. [4]
It cannot rule out kidney disease. An in-range ratio does not override abnormal creatinine trends, urine albumin or other evidence. [5]
It cannot diagnose bleeding, liver disease or malnutrition. Those conditions can affect the component measurements, but require their own assessment.
It cannot prescribe a fluid intake. An abnormal ratio is not enough information to decide whether additional fluid is appropriate.
Common interpretation mistakes
Reading the ratio as the BUN result. A ratio of 30 is not a BUN concentration of 30 mg/dL.
Assuming normal component results guarantee a normal ratio. Two values can each lie within their laboratory intervals while their quotient falls outside the ratio interval.
Comparing different calculations. BUN measures urea nitrogen, not the full urea molecule. A report using total urea, or different units, cannot be compared by copying the US calculation and reference interval.
Using an in-range ratio as an all-clear. The ratio can conceal changes when both component values move in the same direction.
Questions your doctor may ask
Have you had vomiting, diarrhea, reduced intake or a recent illness? Has your protein intake changed? Have you lost weight or muscle? Which medicines and supplements do you take? Are you passing less urine, and how do these results compare with previous tests?
These questions help interpret the component measurements; the ratio cannot answer them by itself. [2–6]
Read together with
BUN and serum creatinine supply the calculation. eGFR, interpreted in the appropriate clinical setting, helps assess filtration. Urinalysis and urine albumin-to-creatinine ratio look for findings the blood ratio cannot provide. Other tests depend on the clinical question. [5]
Clinical pearls
-
A high ratio can arise from a low denominator, not only a high numerator.
-
A normal-range creatinine does not automatically exclude kidney disease, particularly when muscle mass makes it misleading. [3,5]
-
A change in the ratio is easier to interpret when both component results and their units are available.
-
Reference intervals and diagnostic decision limits serve different purposes.
When to seek medical care
Arrange follow-up for an unexplained abnormal result, particularly if BUN or creatinine is also abnormal or changing.
Seek urgent assessment if you are passing much less urine or cannot keep fluids down. Seek emergency care for vomiting blood, black tarry stools, new confusion or severe breathlessness. Do not wait for the ratio to cross a particular number before seeking help. [6,7]
Clinical Takeaway
Use the ratio to compare BUN with creatinine, then return to the individual values. A high result is not proof of dehydration, a low result does not name a disease, and an in-range result does not establish normal kidney function.
In one sentence
The urea nitrogen/creatinine ratio describes how two blood measurements relate; their actual levels and trends explain why that relationship matters.
Bottom line
Find the BUN. Find the creatinine. Interpret the ratio with both in view.
 Urea nitrogen/Creatinine
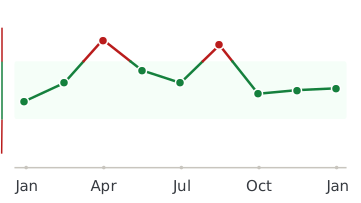
Every lab result you’ve ever had, charted and explained.
Healthmatters is a tracker for your lab results. Upload a report from any lab, any country — every marker charted and explained.
Start with my report →
Frequently Asked Questions
Is urea nitrogen/creatinine the same as the BUN/creatinine ratio?
What is the normal urea nitrogen/creatinine ratio?
Can my ratio be high when BUN and creatinine are both normal?
Does a high ratio mean dehydration?
Can a normal ratio rule out kidney disease?
Should I drink more water to lower the ratio?
All our content is backed by peer-reviewed studies, academic research, and trusted medical sources. We’re committed to accuracy and transparency — see our editorial policy for details.
-
Urea nitrogen/Creatinine [Mass Ratio] in Serum or Plasma — LOINC 3097-3
-
BUN (Blood Urea Nitrogen)
-
Creatinine Test
-
Diagnostic performance of serum blood urea nitrogen to creatinine ratio for distinguishing prerenal from intrinsic acute kidney injury in the emergency department
-
KDIGO 2024 Clinical Practice Guideline for the Evaluation and Management of Chronic Kidney Disease
-
Acute kidney injury (AKI)
-
Gastrointestinal bleeding