
T4-TBG Index

Other names: Free Thyroxine Index (FTI), T4 Index, T7 Index

Optimal result: 2.5 – 6 index

A high T4-TBG Index indicates an increased estimated level of active thyroid hormone in the bloodstream. This may occur in hyperthyroidism, a condition in which the thyroid gland produces too much hormone. Common causes include Graves’ disease, thyroiditis, or excessive thyroid hormone medication.

Symptoms of elevated thyroid hormone activity may include rapid heartbeat, anxiety, heat intolerance, weight loss despite normal appetite, tremors, and increased sweating. Because thyroid hormone regulation is complex, elevated index values are typically evaluated alongside TSH, free T4, and T3 levels to determine the underlying cause of thyroid overactivity.

A low T4-TBG Index suggests that the estimated level of active thyroid hormone in the bloodstream is reduced. This may occur in conditions such as hypothyroidism, where the thyroid gland does not produce enough thyroid hormone. Symptoms of low thyroid hormone activity can include fatigue, weight gain, cold intolerance, dry skin, constipation, and slowed metabolism.

Low index values may also be seen in severe illness or conditions that affect thyroid hormone production. In most cases, doctors interpret the result together with TSH and free T4 levels to confirm whether hypothyroidism or another thyroid disorder is present.

The T4-TBG Index, also known as the Free Thyroxine Index (FTI), is a calculated value used to estimate the amount of biologically active thyroid hormone in the blood. It adjusts total T4 (thyroxine) levels based on the amount of thyroid hormone–binding proteins, primarily thyroxine-binding globulin (TBG). Because most thyroid hormone circulates bound to proteins and only a small fraction is free and biologically active, this index helps clinicians better interpret thyroid function when total T4 levels may be influenced by changes in binding proteins.

The T4-TBG Index is a calculated marker used to estimate the amount of free (unbound) thyroxine available in the bloodstream. Thyroxine (T4) is one of the main hormones produced by the thyroid gland and plays a central role in regulating metabolism, energy production, body temperature, and growth.

In circulation, the majority of T4 is bound to transport proteins, especially thyroxine-binding globulin (TBG). Approximately 99% of T4 is bound to proteins, leaving only a small fraction available in its free, biologically active form. Changes in TBG levels—due to factors such as pregnancy, hormone therapy, liver disease, or genetic variation—can significantly affect total T4 measurements without reflecting true thyroid dysfunction.

The T4-TBG Index was developed to correct for these effects by combining measurements of total T4 with an estimate of thyroid hormone binding capacity (often measured as T3 uptake or directly through TBG levels). By adjusting total T4 for the amount of available binding protein, the index provides a better estimate of the amount of free thyroid hormone circulating in the body.

Historically, the T4-TBG Index was widely used in thyroid function testing. Today, many laboratories measure free T4 directly, which generally provides a more accurate assessment of thyroid hormone status. However, the T4-TBG Index may still appear on certain laboratory panels and can be helpful when evaluating thyroid function in situations where binding protein levels may be altered.

Abnormal results may indicate thyroid dysfunction, including conditions such as hyperthyroidism or hypothyroidism. Because the index reflects estimated free thyroid hormone activity, it is typically interpreted alongside other thyroid markers, including TSH, free T4, total T4, and T3.

T4-TBG Index
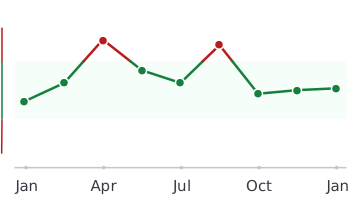
Healthmatters dashboard showing biomarker trend graph

Every lab result you’ve ever had, charted and explained.

Healthmatters is a tracker for your lab results. Upload a report from any lab, any country — every marker charted and explained.

Start with my report →
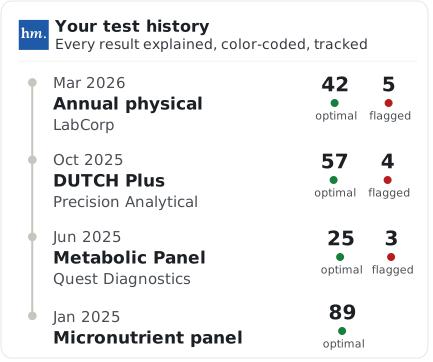
Beyond T4-TBG Index — 10,000+ markers explained
One T4-TBG Index result tells you where you are. Your history tells you where you’re heading. Upload your past lab reports and see this marker — and every marker on them —every marker charted against your own lab’s ranges.
Start with this report →
Healthmatters timeline preview showing biomarker trends over time
Clinical Sources & References

All our content is backed by peer-reviewed studies, academic research, and trusted medical sources. We’re committed to accuracy and transparency — see our editorial policy for details.

Article Review Log
Written by Healthmatters Editorial Team
Healthmatters Lifetime Plan

Pay $250. Track your health forever

One payment. No renewals. Yours for life.

10,000+ biomarkers explained · trends over time

See other plans →
Secure checkout via Stripe · GDPR & HIPAA
We accept results from any lab
LabCorp Quest Diagnostics Genova Diagnostics DUTCH Test Doctor's Data Vibrant America ZRT Laboratory Cyrex Labs + any other lab

What members are saying

★★★★★ 10,000+ happy members
★★★★★

"Watching my numbers move over the years — instead of forgetting last time's results — completely changed how I manage my health."

Daniel
Member since 2022
★★★★★

"Living across several countries made keeping my lab results organized a real challenge. Healthmatters brought my results from the USA, Spain, and Germany together — 20 years of history, with long-term trends instead of scattered reports."

Ben
Member since 2021 · tracks across countries
★★★★★

"Standard lab ranges are too wide for how I practice — 'normal' isn't optimal. I set my own bands, so a client sees yellow before a marker goes officially out of range. That's the conversation I want to be having."

Dr. Alexandra
Functional medicine · 6 yrs on Pro