
SAM/SAH Ratio

Optimal result: 4.7 – 9.5 Ratio

A high SAM/SAH Ratio suggests strong methylation capacity and a favorable balance between methyl donors and inhibitors. High ratios are often seen with adequate folate and B-vitamin status, efficient homocysteine recycling, or increased SAM availability. Very high ratios may sometimes occur with supplemental methyl donors (such as SAMe, methylfolate, or methylcobalamin). Interpretation is most accurate when reviewed alongside individual SAM and SAH levels.

A low SAM/SAH Ratio indicates reduced methylation capacity. This often results from low SAM, high SAH, or both. Common contributors include folate, B12, or B6 deficiency; impaired homocysteine clearance; oxidative stress; chronic inflammation; or genetic variations affecting the folate and methylation pathways. Low ratios may be associated with fatigue, mood changes, cognitive issues, poor detoxification, elevated homocysteine, and impaired cellular repair.

The SAM/SAH Ratio is a key indicator of how efficiently your body performs methylation—the process that supports DNA repair, detoxification, neurotransmitter balance, hormone metabolism, and cellular energy. A higher ratio suggests stronger methylation activity, while a low ratio indicates reduced capacity, often due to nutrient deficiencies, metabolic stress, or folate-cycle imbalances. This marker provides one of the clearest overall snapshots of methylation health.

The SAM/SAH Ratio is one of the most clinically meaningful measurements in methylation and one-carbon metabolism. It reflects the balance between S-Adenosylmethionine (SAM), the body’s primary methyl donor, and S-Adenosylhomocysteine (SAH), a potent inhibitor of methylation reactions. Because nearly all methylation enzymes are sensitive to SAH levels, the ratio of SAM to SAH is widely regarded as the most accurate indicator of global methylation capacity.

A high SAM/SAH ratio suggests a favorable biochemical environment for methylation, supporting healthy gene expression, neurotransmitter synthesis, phospholipid production, liver detoxification, and cellular repair. A low ratio indicates limited methylation efficiency, often caused by folate or B-vitamin deficiencies, oxidative stress, chronic inflammation, poor homocysteine recycling, or genetic variations in folate-cycle enzymes (such as MTHFR or MTRR).

This ratio is biologically more informative than either SAM or SAH alone. Even normal SAM levels can be functionally low if SAH is elevated. Conversely, a high SAM value may not represent healthy methylation if SAH is also high. Evaluating the ratio provides critical insight for individuals experiencing fatigue, mood changes, fertility issues, neurological symptoms, cardiovascular risk, chronic inflammation, or detoxification problems—all of which rely on efficient methylation.

Assessing the SAM/SAH Ratio alongside methylated folate (5-MTHF), homocysteine, and related folate-cycle markers helps identify nutrient needs and supports a personalized approach to optimizing methylation and metabolic health.

SAM/SAH Ratio
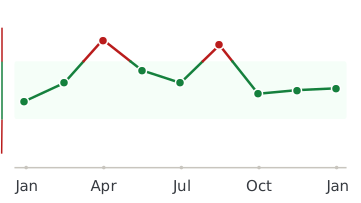
Healthmatters dashboard showing biomarker trend graph

Every lab result you’ve ever had, charted and explained.

Healthmatters is a tracker for your lab results. Upload a report from any lab, any country — every marker charted and explained.

Start with my report →
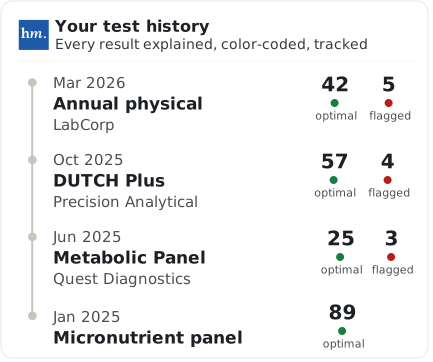
Beyond SAM/SAH Ratio — 10,000+ markers explained
One SAM/SAH Ratio result tells you where you are. Your history tells you where you’re heading. Upload your past lab reports and see this marker — and every marker on them —every marker charted against your own lab’s ranges.
Start with this report →
Healthmatters timeline preview showing biomarker trends over time
Clinical Sources & References

All our content is backed by peer-reviewed studies, academic research, and trusted medical sources. We’re committed to accuracy and transparency — see our editorial policy for details.

Article Review Log
Written by Healthmatters Editorial Team
Healthmatters Lifetime Plan

Pay $250. Track your health forever

One payment. No renewals. Yours for life.

10,000+ biomarkers explained · trends over time

See other plans →
Secure checkout via Stripe · GDPR & HIPAA
We accept results from any lab
LabCorp Quest Diagnostics Genova Diagnostics DUTCH Test Doctor's Data Vibrant America ZRT Laboratory Cyrex Labs + any other lab

What members are saying

★★★★★ 10,000+ happy members
★★★★★

"Watching my numbers move over the years — instead of forgetting last time's results — completely changed how I manage my health."

Daniel
Member since 2022
★★★★★

"Living across several countries made keeping my lab results organized a real challenge. Healthmatters brought my results from the USA, Spain, and Germany together — 20 years of history, with long-term trends instead of scattered reports."

Ben
Member since 2021 · tracks across countries
★★★★★

"Standard lab ranges are too wide for how I practice — 'normal' isn't optimal. I set my own bands, so a client sees yellow before a marker goes officially out of range. That's the conversation I want to be having."

Dr. Alexandra
Functional medicine · 6 yrs on Pro