
HDL-3

Optimal result: 30 – 100 mg/dL

HDL3-C subfractions are significantly and inversely associated with arterial stiffness. HDL2-C subfractions are not associated with arterial stiffness, suggesting that HDL subfractions are likely more important in preventing cardiovascular and cerebrovascular disease. 

Both total HDL and HDL2 levels have inverse associations with the risk of acute myocardial infarction and may thus be protective factors in ischemic heart disease, whereas the role of HDL3 remains equivocal.

HDL3-C subfractions are significantly and inversely associated with arterial stiffness. HDL2-C subfractions are not associated with arterial stiffness, suggesting that HDL subfractions are likely more important in preventing cardiovascular and cerebrovascular disease. 

Both total HDL and HDL2 levels have inverse associations with the risk of acute myocardial infarction and may thus be protective factors in ischemic heart disease, whereas the role of HDL3 remains equivocal.

HDL3-C subfractions are significantly and inversely associated with arterial stiffness, suggesting that HDL subfractions are likely more important than HDL-C in preventing cardiovascular disease.

Broadly, HDL can be distinguished into two subfractions, by density: HDL2 cholesterol (HDL2-C) and HDL3 cholesterol (HDL3-C). HDL3-C is well approximated by the sum of small and medium HDL particles (HDL-P), whereas HDL2-C correlates strongly with large HDL-P. There is no consensus, however, on the functions of HDL2-C and HDL3-C. Whereas some researchers have confirmed that large HDL-Ps have a protective effect on CHD, others recognized that the small, dense, protein-rich HDL-Ps display more potent atheroprotective properties than large, buoyant cholesterol-rich particles.

HDL3-C subfractions are significantly and inversely associated with arterial stiffness, suggesting that HDL subfractions are likely more important than HDL-C in preventing cardiovascular disease.

Broadly, HDL can be distinguished into two subfractions, by density: HDL2 cholesterol (HDL2-C) and HDL3 cholesterol (HDL3-C). HDL3-C is well approximated by the sum of small and medium HDL particles (HDL-P), whereas HDL2-C correlates strongly with large HDL-P. There is no consensus, however, on the functions of HDL2-C and HDL3-C. Whereas some researchers have confirmed that large HDL-Ps have a protective effect on CHD, others recognized that the small, dense, protein-rich HDL-Ps display more potent atheroprotective properties than large, buoyant cholesterol-rich particles.

HDL3 carries enzymes that prevent oxidative stress and receives cholesterol from reverse cholesterol transport through the ATP-binding cassette transporter A1 mediators. Earlier studies that measured the cholesterol content of HDL subclasses using density gradient ultracentrifugation suggested that the large HDL2-C subfractions are better predictors of CHD. With the availability of newer HDL measures, however, more recent studies using the same separation technique have found that smaller HDL3-C subfractions play this role.

References:

Wang, F., Wang, X., Ye, P. et al. High-density lipoprotein 3 cholesterol is a predictive factor for arterial stiffness: a community-based 4.8-year prospective study. Lipids Health Dis 17, 5 (2018). https://doi.org/10.1186/s12944-017-0650-z

Salonen JT, Salonen R, Seppänen K, Rauramaa R, Tuomilehto J. HDL, HDL2, and HDL3 subfractions, and the risk of acute myocardial infarction. A prospective population study in eastern Finnish men. Circulation. 1991 Jul;84(1):129-39. doi: 10.1161/01.cir.84.1.129. PMID: 2060089.

HDL-3
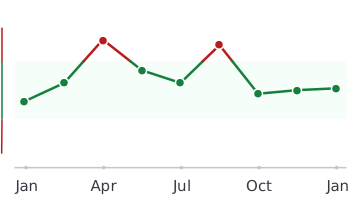
Healthmatters dashboard showing biomarker trend graph

Every lab result you’ve ever had, charted and explained.

Healthmatters is a tracker for your lab results. Upload a report from any lab, any country — every marker charted and explained.

Start with my report →
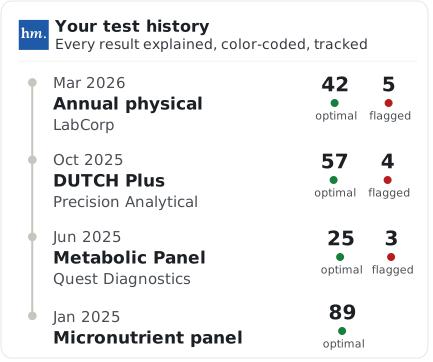
Beyond HDL-3 — 10,000+ markers explained
One HDL-3 result tells you where you are. Your history tells you where you’re heading. Upload your past lab reports and see this marker — and every marker on them —every marker charted against your own lab’s ranges.
Start with this report →
Healthmatters timeline preview showing biomarker trends over time
Clinical Sources & References

All our content is backed by peer-reviewed studies, academic research, and trusted medical sources. We’re committed to accuracy and transparency — see our editorial policy for details.

Article Review Log
Written by Healthmatters Editorial Team
Healthmatters Lifetime Plan

Pay $250. Track your health forever

One payment. No renewals. Yours for life.

10,000+ biomarkers explained · trends over time

See other plans →
Secure checkout via Stripe · GDPR & HIPAA
We accept results from any lab
LabCorp Quest Diagnostics Genova Diagnostics DUTCH Test Doctor's Data Vibrant America ZRT Laboratory Cyrex Labs + any other lab

What members are saying

★★★★★ 10,000+ happy members
★★★★★

"Watching my numbers move over the years — instead of forgetting last time's results — completely changed how I manage my health."

Daniel
Member since 2022
★★★★★

"Living across several countries made keeping my lab results organized a real challenge. Healthmatters brought my results from the USA, Spain, and Germany together — 20 years of history, with long-term trends instead of scattered reports."

Ben
Member since 2021 · tracks across countries
★★★★★

"Standard lab ranges are too wide for how I practice — 'normal' isn't optimal. I set my own bands, so a client sees yellow before a marker goes officially out of range. That's the conversation I want to be having."

Dr. Alexandra
Functional medicine · 6 yrs on Pro