Dysbiosis Patterns

Sample type: Stool
Zone 1
The commensal profile in this zone does not align with profiles associated with intestinal inflammation or immunosuppression. If inflammatory biomarkers are present, other causes need to be excluded, such as infection, food allergy, or more serious pathology.
Zone 2
This pattern of bacteria is associated with impaired intestinal barrier function (low fecal sIgA and EPX). Patients in this zone have higher rates of opportunistic infections (e.g. Blastocystis spp. & Dientamoeba fragilis ) as well as fecal fat malabsorption. Commensal abundance is higher in this group suggesting potential bacterial overgrowth.
Zone 3
Patients in this zone may have more inflammation compared to those in zone 4. However, commensal abundance is usually higher making use of antimicrobial therapy relatively safer. Patients in this zone may have higher rates of pathogenic infections.
Zone 4
This commensal profile is associated with increased intestinal inflammation. IBD patients are more likely to have this pattern of bacteria. Commensal abundance is lower in this zone; therefore, antibiotic use for GI potential pathogens should be used with caution. In addition to standard treatment for intestinal inflammation, modulation of the commensal gut profile is encouraged.

Genova’s data analysis has led to the development of unique dysbiosis patterns, related to key physiologic disruptions, such as immunosuppression and inflammation. These patterns may represent dysbiotic changes that could pose clinical significance. 

Dysbiosis Patterns
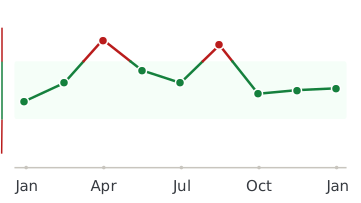
Healthmatters dashboard showing biomarker trend graph

Every lab result you’ve ever had, charted and explained.

Healthmatters is a tracker for your lab results. Upload a report from any lab, any country — every marker charted and explained.

Start with my report →
Beyond Dysbiosis Patterns — 10,000+ markers explained
One Dysbiosis Patterns result tells you where you are. Your history tells you where you’re heading. Upload your past lab reports and see this marker — and every marker on them —every marker charted against your own lab’s ranges.
Start with this report →
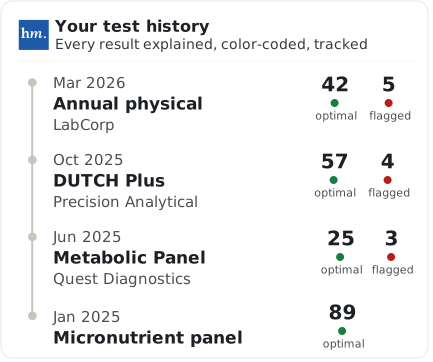
Healthmatters timeline preview showing biomarker trends over time
Clinical Sources & References

All our content is backed by peer-reviewed studies, academic research, and trusted medical sources. We’re committed to accuracy and transparency — see our editorial policy for details.

Article Review Log
Written by Healthmatters Editorial Team
Healthmatters Lifetime Plan

Pay $250. Track your health forever

One payment. No renewals. Yours for life.

10,000+ biomarkers explained · trends over time

See other plans →
Secure checkout via Stripe · GDPR & HIPAA
We accept results from any lab
LabCorp Quest Diagnostics Genova Diagnostics DUTCH Test Doctor's Data Vibrant America ZRT Laboratory Cyrex Labs + any other lab

What members are saying

★★★★★ 10,000+ happy members
★★★★★

"Watching my numbers move over the years — instead of forgetting last time's results — completely changed how I manage my health."

Daniel
Member since 2022
★★★★★

"Living across several countries made keeping my lab results organized a real challenge. Healthmatters brought my results from the USA, Spain, and Germany together — 20 years of history, with long-term trends instead of scattered reports."

Ben
Member since 2021 · tracks across countries
★★★★★

"Standard lab ranges are too wide for how I practice — 'normal' isn't optimal. I set my own bands, so a client sees yellow before a marker goes officially out of range. That's the conversation I want to be having."

Dr. Alexandra
Functional medicine · 6 yrs on Pro