
Cis-Aconitate

Optimal result: 10 – 36 mmol/mol creatinine

Iron deficiencies and overload at the systemic or cellular levels can negatively impact the aconitase enzyme and overall mitochondrial health and function. Due diligence with iron assessment is recommended when levels of these organic acids are abnormal. Glutathione may also be an important means of modulating aconitase activity during oxidative stress. Various toxins may influence mitochondrial enzymes and contribute to mitochondrial dysfunction, such as fluoride, aluminum, mercury, arsenic, and tin.

Possible causes:

- Impaired metabolism due to toxic metals (Fl, Hg, As) 
- OR low cofactors (Fe, GSH—depleted in oxidative stress)
- OR high amounts of dietary citric acid
- OR metabolic acidosis (if mildly increased cisaconitic acid but markedly increased citric acid).
- Low glutathione
- High amounts of dietary citric acid
- Metabolic acidosis (if mildly increased cis-aconitic acid but markedly increased citric acid)
- High levels can indicate ammonia toxicity or arginine insufficieny.
- An elevated level of this organic acid may be an indication of poor supplies or metabolism of amino acids. A clinical sign is fatigue.
- If elevated with orotate, isocitrate and citrate, suspect hyperammonia.
- High Citrate and Cis-aconitate can indicate arginine insufficiency for ammonia clearance through the Urea Cycle.

Additional investigations:

- Comprehensive Urine Elements Profile

- Functional Liver Detoxification Profile

- Complete Digestive Stool Analysis

Treatment considerations:

- Rule out toxic metals

- Glutathione-

- Consider supplementing with arginine and possibly cysteine.

Some foods high in argininer are:

- Pumpkin seeds

- Sesame seeds

- Dried walnuts

- Almonds

- Pine nuts

- Soy beans

- Chickpeas

- Seaweed

(Do not take L-arginine if you have had a recent heart attack.)

Additional investigations:

- Comprehensive Urine Elements Profile
- Functional Liver Detoxification Profile
- Complete Digestive Stool Analysis
- Rule out toxic metals and check for iron deficiency

cis-Aconitate is an Energy Production Marker. Low levels of these analytes may reflect insufficient precursors, or suboptimal glycolysis or fatty acid oxidation.

Possible correlation:

If cis-Aconitic Acid is measured to be low, and its precursor, citric acid, is also low:

In this case, the cis-aconitic acid deficiency is considered to be secondary to the subnormal citrate level; please refer to the commentary for low citrate.

Common Metabolic Association:

Amino Acid insufficiency

Possible causes:

Low or high pyruvic acid or low acetyCoA (from fatty acid oxidation).

Intervention Options:

Free-form amino acids

cis-Aconitate is involved in both energy production and removal of toxic ammonia.

A two-carbon group from Acetyl-CoA is transferred to oxaloacetate to form citric acid. Citric acid is then converted to isocitric acid through a cisaconitic intermediate using the enzyme aconitase. Aconitase is an iron-sulfate protein that controls iron homeostasis.

-----------------------

Citric acid, cis-aconitic acid, and isocitric acid are the first three metabolites in the Krebs Citric Acid energy production cycle, which operates in the mitochondria of your cells. 

Citrate, cis-Aconitate (and Isocitrate) are involved in both energy production and removal of toxic ammonia.

High levels can indicate ammonia toxicity. Chronic loss of these valuable compounds can contribute to loss of organ reserve and disturbances in neurological function. If they are low they can indicate a need for essential amino acids, especially arginine.

Nutrient association: Arginine, Iron

References:

- Medline.gov - Arginine [L]

Cis-Aconitate
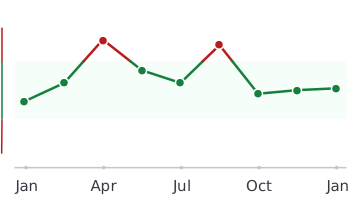
Healthmatters dashboard showing biomarker trend graph

Every lab result you’ve ever had, charted and explained.

Healthmatters is a tracker for your lab results. Upload a report from any lab, any country — every marker charted and explained.

Start with my report →
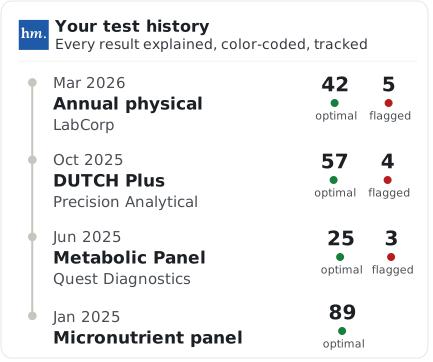
Beyond Cis-Aconitate — 10,000+ markers explained
One Cis-Aconitate result tells you where you are. Your history tells you where you’re heading. Upload your past lab reports and see this marker — and every marker on them —every marker charted against your own lab’s ranges.
Start with this report →
Healthmatters timeline preview showing biomarker trends over time
Clinical Sources & References

All our content is backed by peer-reviewed studies, academic research, and trusted medical sources. We’re committed to accuracy and transparency — see our editorial policy for details.

Article Review Log
Written by Healthmatters Editorial Team
Healthmatters Lifetime Plan

Pay $250. Track your health forever

One payment. No renewals. Yours for life.

10,000+ biomarkers explained · trends over time

See other plans →
Secure checkout via Stripe · GDPR & HIPAA
We accept results from any lab
LabCorp Quest Diagnostics Genova Diagnostics DUTCH Test Doctor's Data Vibrant America ZRT Laboratory Cyrex Labs + any other lab

What members are saying

★★★★★ 10,000+ happy members
★★★★★

"Watching my numbers move over the years — instead of forgetting last time's results — completely changed how I manage my health."

Daniel
Member since 2022
★★★★★

"Living across several countries made keeping my lab results organized a real challenge. Healthmatters brought my results from the USA, Spain, and Germany together — 20 years of history, with long-term trends instead of scattered reports."

Ben
Member since 2021 · tracks across countries
★★★★★

"Standard lab ranges are too wide for how I practice — 'normal' isn't optimal. I set my own bands, so a client sees yellow before a marker goes officially out of range. That's the conversation I want to be having."

Dr. Alexandra
Functional medicine · 6 yrs on Pro