
What Does CD3+/CD8+ % Mean in a Blood Test?
CD3+/CD8+ % refers to the percentage of cytotoxic T cells (CD8+) among all T-lymphocytes (CD3+ cells) in your blood. This immune marker is measured using flow cytometry and is commonly included in T-cell subset panels to evaluate immune system status.
Understanding the Components
-
CD3+ T cells: Represent all mature T lymphocytes, which are essential for adaptive immunity.
-
CD8+ T cells: A subset of CD3+ cells, often called cytotoxic T cells, that directly kill infected or abnormal cells (like virus-infected cells or cancer cells).
-
CD3+/CD8+ %: Indicates the proportion of cytotoxic T cells among total T cells, helping assess immune activation, suppression, or imbalance.
Why Is CD3+/CD8+ % Important?
This marker is helpful in:
-
Monitoring viral infections (especially HIV, where CD8+ levels often rise)
-
Evaluating immune activation or suppression
-
Tracking autoimmune and inflammatory conditions
-
Assessing immune recovery after bone marrow transplant or chemotherapy
Normal Range
-
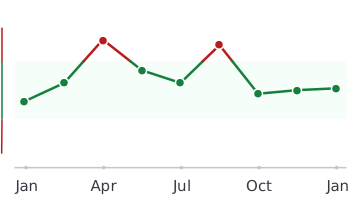
CD3+/CD8+ % Normal Range: Approximately 15% to 40%
-
This range may vary by lab and patient population.
What Can Cause Elevated CD3+/CD8+ % Levels?
-
Viral Infections
Acute or chronic viral infections—such as HIV, Epstein-Barr virus (EBV), cytomegalovirus (CMV), or influenza—can activate and expand CD8+ T cells, raising their percentage. -
HIV Infection
CD8+ levels often increase in HIV, especially in the early stages, as the immune system tries to control the virus. Over time, a persistently high CD8+ % with a falling CD4+ % may indicate immune system stress or progression. -
Chronic Inflammation
Conditions with long-standing immune activation (such as autoimmune diseases or certain cancers) can drive up CD8+ T-cell percentages. -
Immunosenescence (Age-Related Immune Changes)
In older adults, CD8+ percentages may increase as part of a shift in T-cell composition related to immune aging. -
Certain Medications or Immune Therapies
Immunomodulators or biologic therapies may alter T-cell distribution, increasing CD8+ populations.
What Can Cause Low CD3+/CD8+ % Levels?
-
Immunodeficiency syndromes
-
Bone marrow suppression
-
Severe infections
-
Certain cancers (like lymphomas)
-
Corticosteroids or chemotherapy
How Is It Interpreted?
CD3+/CD8+ % is most informative when considered alongside:
-
CD4+ T cell percentage
-
CD4/CD8 ratio
-
Absolute CD8+ count
-
Clinical history and symptoms
Summary
CD3+/CD8+ % measures the proportion of cytotoxic T cells among your total T cells and serves as a key indicator of immune system activity. Elevated levels are often seen in viral infections, HIV, and chronic inflammation, while low levels may reflect immune suppression or bone marrow dysfunction. This marker is best interpreted in context with other immune indicators and your overall clinical picture.
 CD3+/CD8+ %
Every lab result you’ve ever had, charted and explained.
Healthmatters is a tracker for your lab results. Upload a report from any lab, any country — every marker charted and explained.
Start with my report →
All our content is backed by peer-reviewed studies, academic research, and trusted medical sources. We’re committed to accuracy and transparency — see our editorial policy for details.