
A-a O2

In an Arterial Blood Gas (ABG) analysis, the term A-a O2 refers to the alveolar-arterial oxygen gradient. It measures the difference between the oxygen concentration in the alveoli of the lungs and the arterial system. Alveoli are tiny, balloon-shaped air sacs in the lungs that perform gas exchange between inhaled air and the blood.

This gradient is important because it can help to identify how well oxygen is being transferred from the lungs to the blood. A larger-than-normal gradient suggests that there may be a problem with oxygen transfer, which could be due to various reasons such as lung diseases or issues with the pulmonary circulation.

In an Arterial Blood Gas (ABG) analysis, the term A-a O2 refers to the alveolar-arterial oxygen gradient. It measures the difference between the oxygen concentration in the alveoli of the lungs and the arterial system. Alveoli are tiny, balloon-shaped air sacs in the lungs that perform gas exchange between inhaled air and the blood.

This gradient is important because it can help to identify how well oxygen is being transferred from the lungs to the blood. A larger-than-normal gradient suggests that there may be a problem with oxygen transfer, which could be due to various reasons such as lung diseases or issues with the pulmonary circulation.

The calculation of the A-a O2 gradient takes into account the partial pressure of oxygen in the arterial blood (PaO2), the partial pressure of oxygen in the inhaled air (PAO2), and factors in the presence of carbon dioxide (PaCO2) and the respiratory exchange ratio.

It's typically used to assess the respiratory function and to diagnose and monitor conditions that affect the lungs and oxygenation.

A-a O2
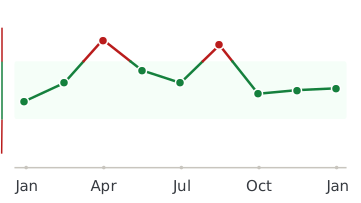
Healthmatters dashboard showing biomarker trend graph

Every lab result you’ve ever had, charted and explained.

Healthmatters is a tracker for your lab results. Upload a report from any lab, any country — every marker charted and explained.

Start with my report →
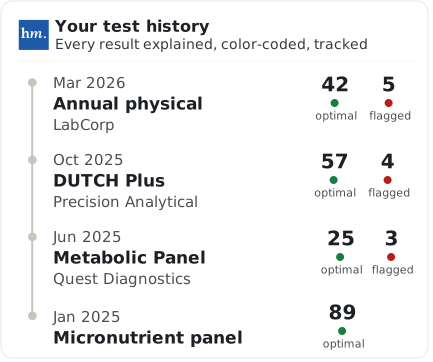
Beyond A-a O2 — 10,000+ markers explained
One A-a O2 result tells you where you are. Your history tells you where you’re heading. Upload your past lab reports and see this marker — and every marker on them —every marker charted against your own lab’s ranges.
Start with this report →
Healthmatters timeline preview showing biomarker trends over time
Clinical Sources & References

All our content is backed by peer-reviewed studies, academic research, and trusted medical sources. We’re committed to accuracy and transparency — see our editorial policy for details.

Article Review Log
Written by Healthmatters Editorial Team
Healthmatters Lifetime Plan

Pay $250. Track your health forever

One payment. No renewals. Yours for life.

10,000+ biomarkers explained · trends over time

See other plans →
Secure checkout via Stripe · GDPR & HIPAA
We accept results from any lab
LabCorp Quest Diagnostics Genova Diagnostics DUTCH Test Doctor's Data Vibrant America ZRT Laboratory Cyrex Labs + any other lab

What members are saying

★★★★★ 10,000+ happy members
★★★★★

"Watching my numbers move over the years — instead of forgetting last time's results — completely changed how I manage my health."

Daniel
Member since 2022
★★★★★

"Living across several countries made keeping my lab results organized a real challenge. Healthmatters brought my results from the USA, Spain, and Germany together — 20 years of history, with long-term trends instead of scattered reports."

Ben
Member since 2021 · tracks across countries
★★★★★

"Standard lab ranges are too wide for how I practice — 'normal' isn't optimal. I set my own bands, so a client sees yellow before a marker goes officially out of range. That's the conversation I want to be having."

Dr. Alexandra
Functional medicine · 6 yrs on Pro