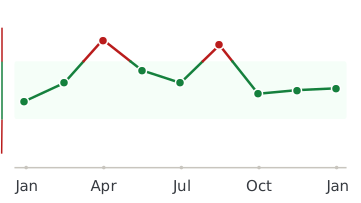
2/16 Ratio

Sample type: Urine
Optimal result: 1.6 – 7.7 Ratio

Increased levels of the 2/16α ratio (above 4) often indicate a dominance of 2-OH E1 relative to 16α-OH E1, which may be associated with a higher risk of osteopenia or osteoporosis. This is because 16α-OH E1 plays a role in bone formation, and excessively low levels of this metabolite can compromise bone health. Elevated ratios might also reflect enhanced estrogen detoxification along the 2-OH E1 pathway, which can reduce the protective bone-building effects of 16α-OH E1. Monitoring bone density and evaluating the need for supportive therapies, such as calcium, vitamin D, or estradiol supplementation, may be necessary in these cases.

An optimal 2/16α ratio falls between 2 and 4. Ratios below 2 may suggest an increased risk of breast cancer, though this concern is less significant when overall estrogen levels are low. Supporting estrogen metabolism toward 2-OH E1 with targeted nutrients may be beneficial in such cases. Ratios above 4, particularly when 16α-OH E1 levels are low, may indicate an elevated risk of osteopenia.

An optimal 2/16α ratio falls between 2 and 4. Ratios below 2 may suggest an increased risk of breast cancer, though this concern is less significant when overall estrogen levels are low. Supporting estrogen metabolism toward 2-OH E1 with targeted nutrients may be beneficial in such cases. Ratios above 4, particularly when 16α-OH E1 levels are low, may indicate an elevated risk of osteopenia.

2/16 Ratio
Healthmatters dashboard showing biomarker trend graph

Every lab result you’ve ever had, charted and explained.

Healthmatters is a tracker for your lab results. Upload a report from any lab, any country — every marker charted and explained.

Start with my report →
Beyond 2/16 Ratio — 10,000+ markers explained
One 2/16 Ratio result tells you where you are. Your history tells you where you’re heading. Upload your past lab reports and see this marker — and every marker on them —every marker charted against your own lab’s ranges.
Start with this report →
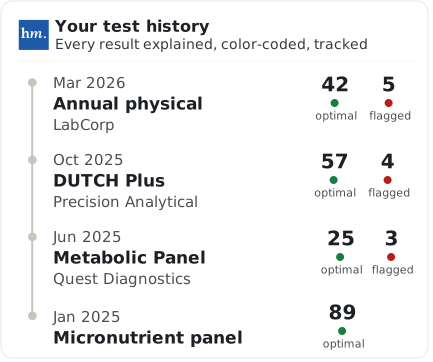
Healthmatters timeline preview showing biomarker trends over time
Clinical Sources & References

All our content is backed by peer-reviewed studies, academic research, and trusted medical sources. We’re committed to accuracy and transparency — see our editorial policy for details.

Article Review Log
Written by Healthmatters Editorial Team
Healthmatters Lifetime Plan

Pay $250. Track your health forever

One payment. No renewals. Yours for life.

10,000+ biomarkers explained · trends over time

See other plans →
Secure checkout via Stripe · GDPR & HIPAA
We accept results from any lab
LabCorp Quest Diagnostics Genova Diagnostics DUTCH Test Doctor's Data Vibrant America ZRT Laboratory Cyrex Labs + any other lab

What members are saying

★★★★★ 10,000+ happy members
★★★★★

"Watching my numbers move over the years — instead of forgetting last time's results — completely changed how I manage my health."

Daniel
Member since 2022
★★★★★

"Living across several countries made keeping my lab results organized a real challenge. Healthmatters brought my results from the USA, Spain, and Germany together — 20 years of history, with long-term trends instead of scattered reports."

Ben
Member since 2021 · tracks across countries
★★★★★

"Standard lab ranges are too wide for how I practice — 'normal' isn't optimal. I set my own bands, so a client sees yellow before a marker goes officially out of range. That's the conversation I want to be having."

Dr. Alexandra
Functional medicine · 6 yrs on Pro