Scattered PDFs and confusing numbers become one timeline you actually understand — every lab, every country.
3 lab reports entered for you — enough to see your first trend. Cancel anytime.
$45 value — normally $15 each
10 lab reports entered for you — your whole history on one timeline from day one.
$150 value — normally $15 each
Entering results yourself is free & unlimited Secure checkout via Stripe HIPAA & GDPR compliant Cancel anytime
Each result comes with a clear explanation of what it means and why it matters — I finally understand my own bloodwork instead of googling every number.

I had a decade of old paper results sitting in a drawer. I sent them in and the team entered every value for me — no typing, no lost weekends. Finally, it was worth it.

I don't wait for something to feel wrong anymore. I can see a marker drifting long before it's a problem — and actually do something about it early.

Three steps. About ten minutes the first time — then it just keeps building, every test you ever take.
Drop in PDFs, photos, or screenshots from any lab, any country. Enter them yourself, or send them over and we'll enter them for you.
Each biomarker is explained, ranged, and flagged. No more guessing what an asterisk means.
Compare across years and labs. Spot the trends one result alone can never tell you.
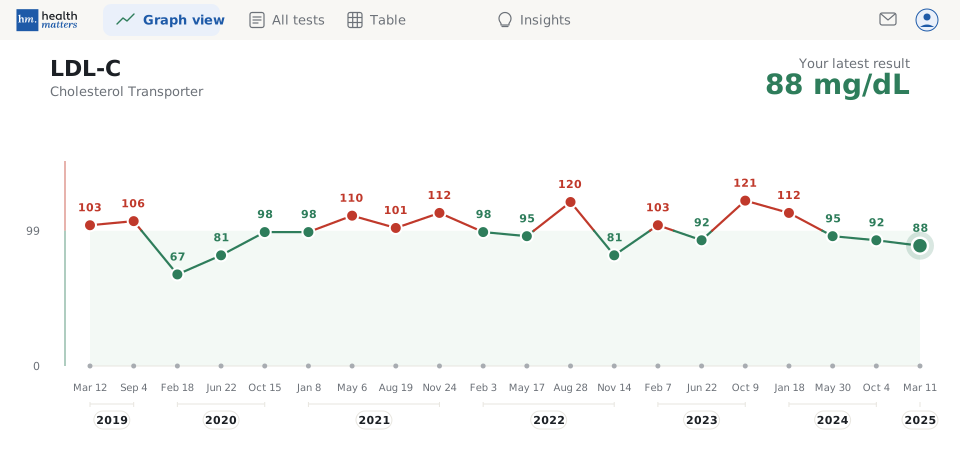
Graph, table, or insights — click to see the same results shown each way. Every lab you’ve taken, organized and explained.
| BIOMARKER | NOV 22 | FEB 23 | JUN 23 | OCT 23 | JAN 24 | MAY 24 | OCT 24 | MAR 25 |
|---|---|---|---|---|---|---|---|---|
| LDL-C0–99 mg/dL | 81 | 103 | 92 | 121 | 112 | 95 | 92 | 88 |
| HDL-C40+ mg/dL | 52 | 54 | 55 | 56 | 55 | 57 | 58 | 58 |
| Triglycerides0–150 mg/dL | 160 | 150 | 158 | 165 | 170 | 168 | 175 | 172 |
| Total Chol.0–200 mg/dL | 200 | 205 | 208 | 215 | 212 | 206 | 204 | 201 |
| ApoB0–100 mg/dL | 93 | 104 | 96 | 114 | 109 | 94 | 93 | 92 |
| hs-CRP0–1 mg/L | 1.3 | 1.5 | 1.6 | 1.8 | 2 | 1.9 | 2.2 | 2.1 |
After peaking at 121 mg/dL in Oct 2023, your levels have steadily declined. The last three readings are all under 99 — your in-range threshold.
Based on 6 results since Jun 2024While LDL-C improved, your triglycerides have moved in the opposite direction — up 28% year-over-year. These two often move together — worth flagging.
Compare side-by-side →Your last lipid panel was Mar 11, 2025. Standard cadence for an in-range result is 6 months — next check suggested around Sep 11, 2025.
Add to calendar →Under 100 mg/dL is generally optimal. Above 100 raises atherosclerotic risk, with 160+ considered high. Personal targets depend on overall risk.
View clinical reference →Add unlimited lab reports — free, on every plan. More entered-for-you reports anytime — $15 each.